Analysis Tools Overview
Go-Architect includes the following Architecture Analysis Tools.
Project Metrics
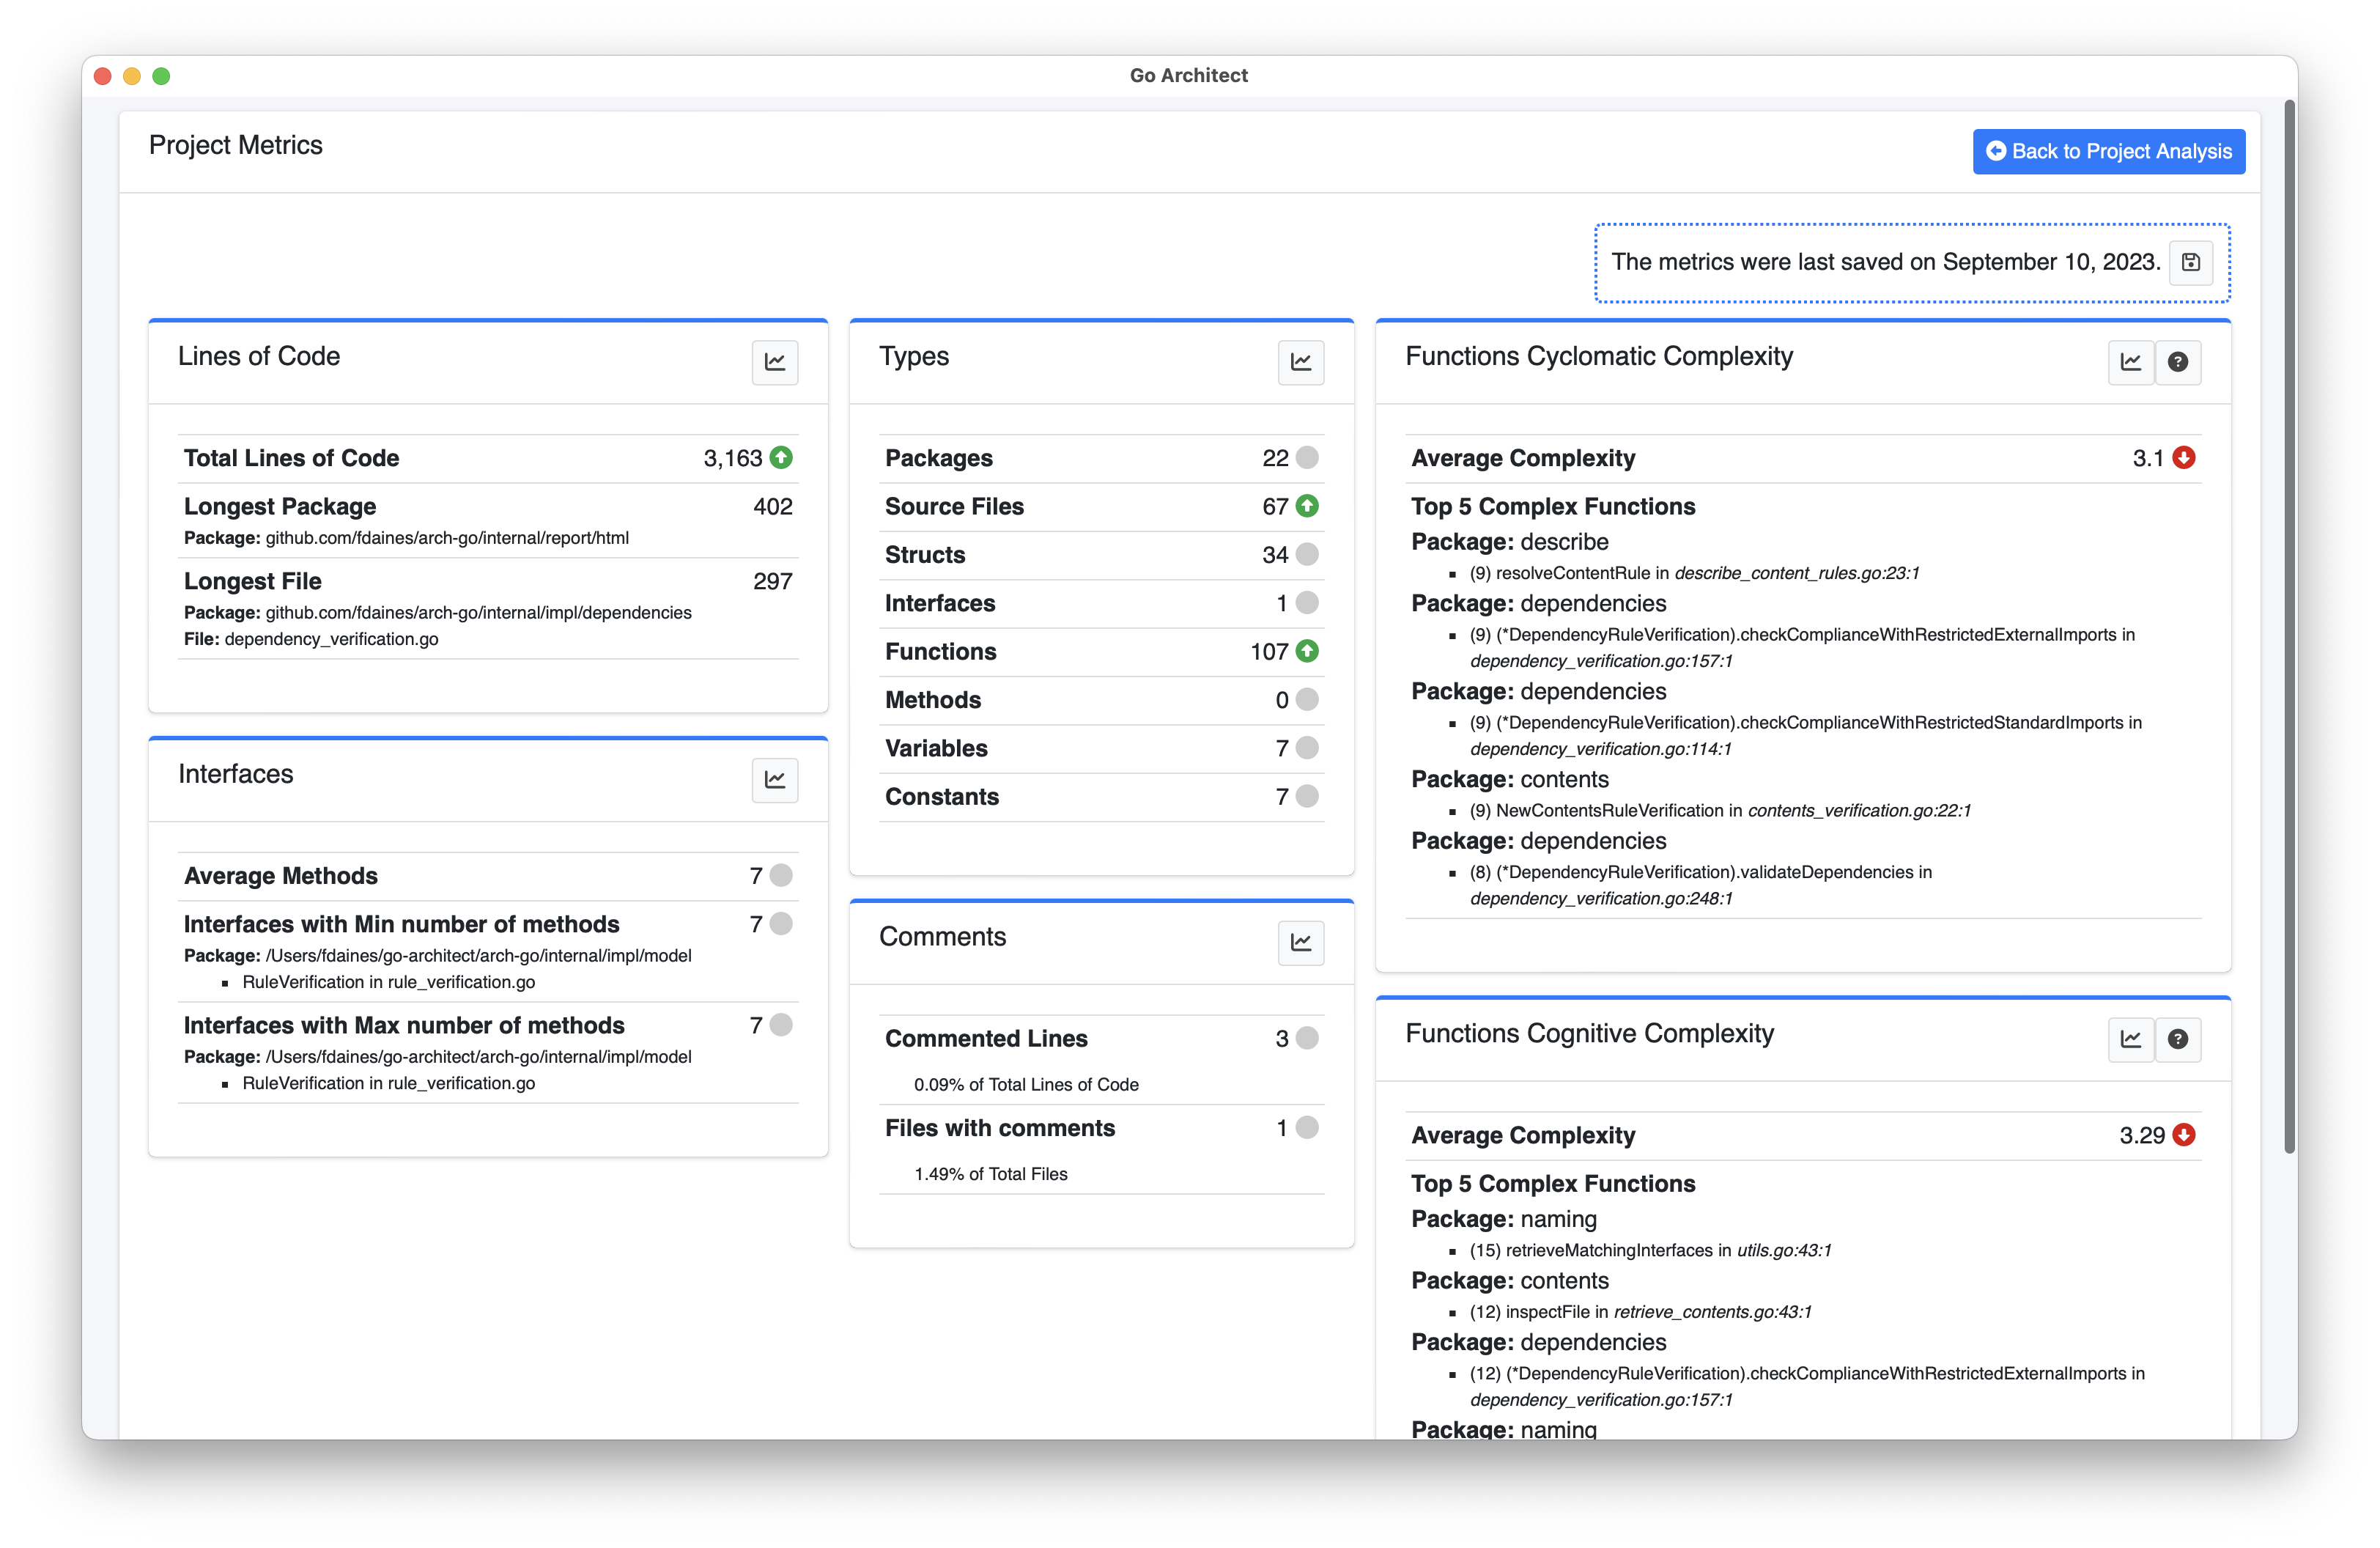
This Tool display common metrics used to have a quick idea of the size and complexity of our project. These metrics includes:
| Metrics Group | Description |
|---|---|
| Lines of Code | Counts the total number of code lines in the project, detecting the greatest package and source file. |
| Interfaces | Displays the average size for an interfaces, and the biggest and smallest interfaces. |
| Types | Counts the number of elements of each kind in the project |
| Comments | Counts comments in the projects. |
| Cyclomatic Complexity | Displays the average cyclomatic complexity for our project, and the top 5 most complex functions. It uses gocyclo to resolve this metrics. |
| Cognitive Complexity | Displays the average cognitive complexity for our project, and the top 5 most complex functions. It uses gocognit to resolve this metrics. |
Each Metrics Group will display an icon that represents the comparison of each metric with the last saved snapshot. The upper right corner shows when was the las time these metrics were saved on the internal DB.
If you want to save the current metrics as a snapshot, just click on the button.
Note Go-Architect only saves one set of metrics for a day, so in case you click several times this button in a day, then you will be updating the snapshot for the current day.
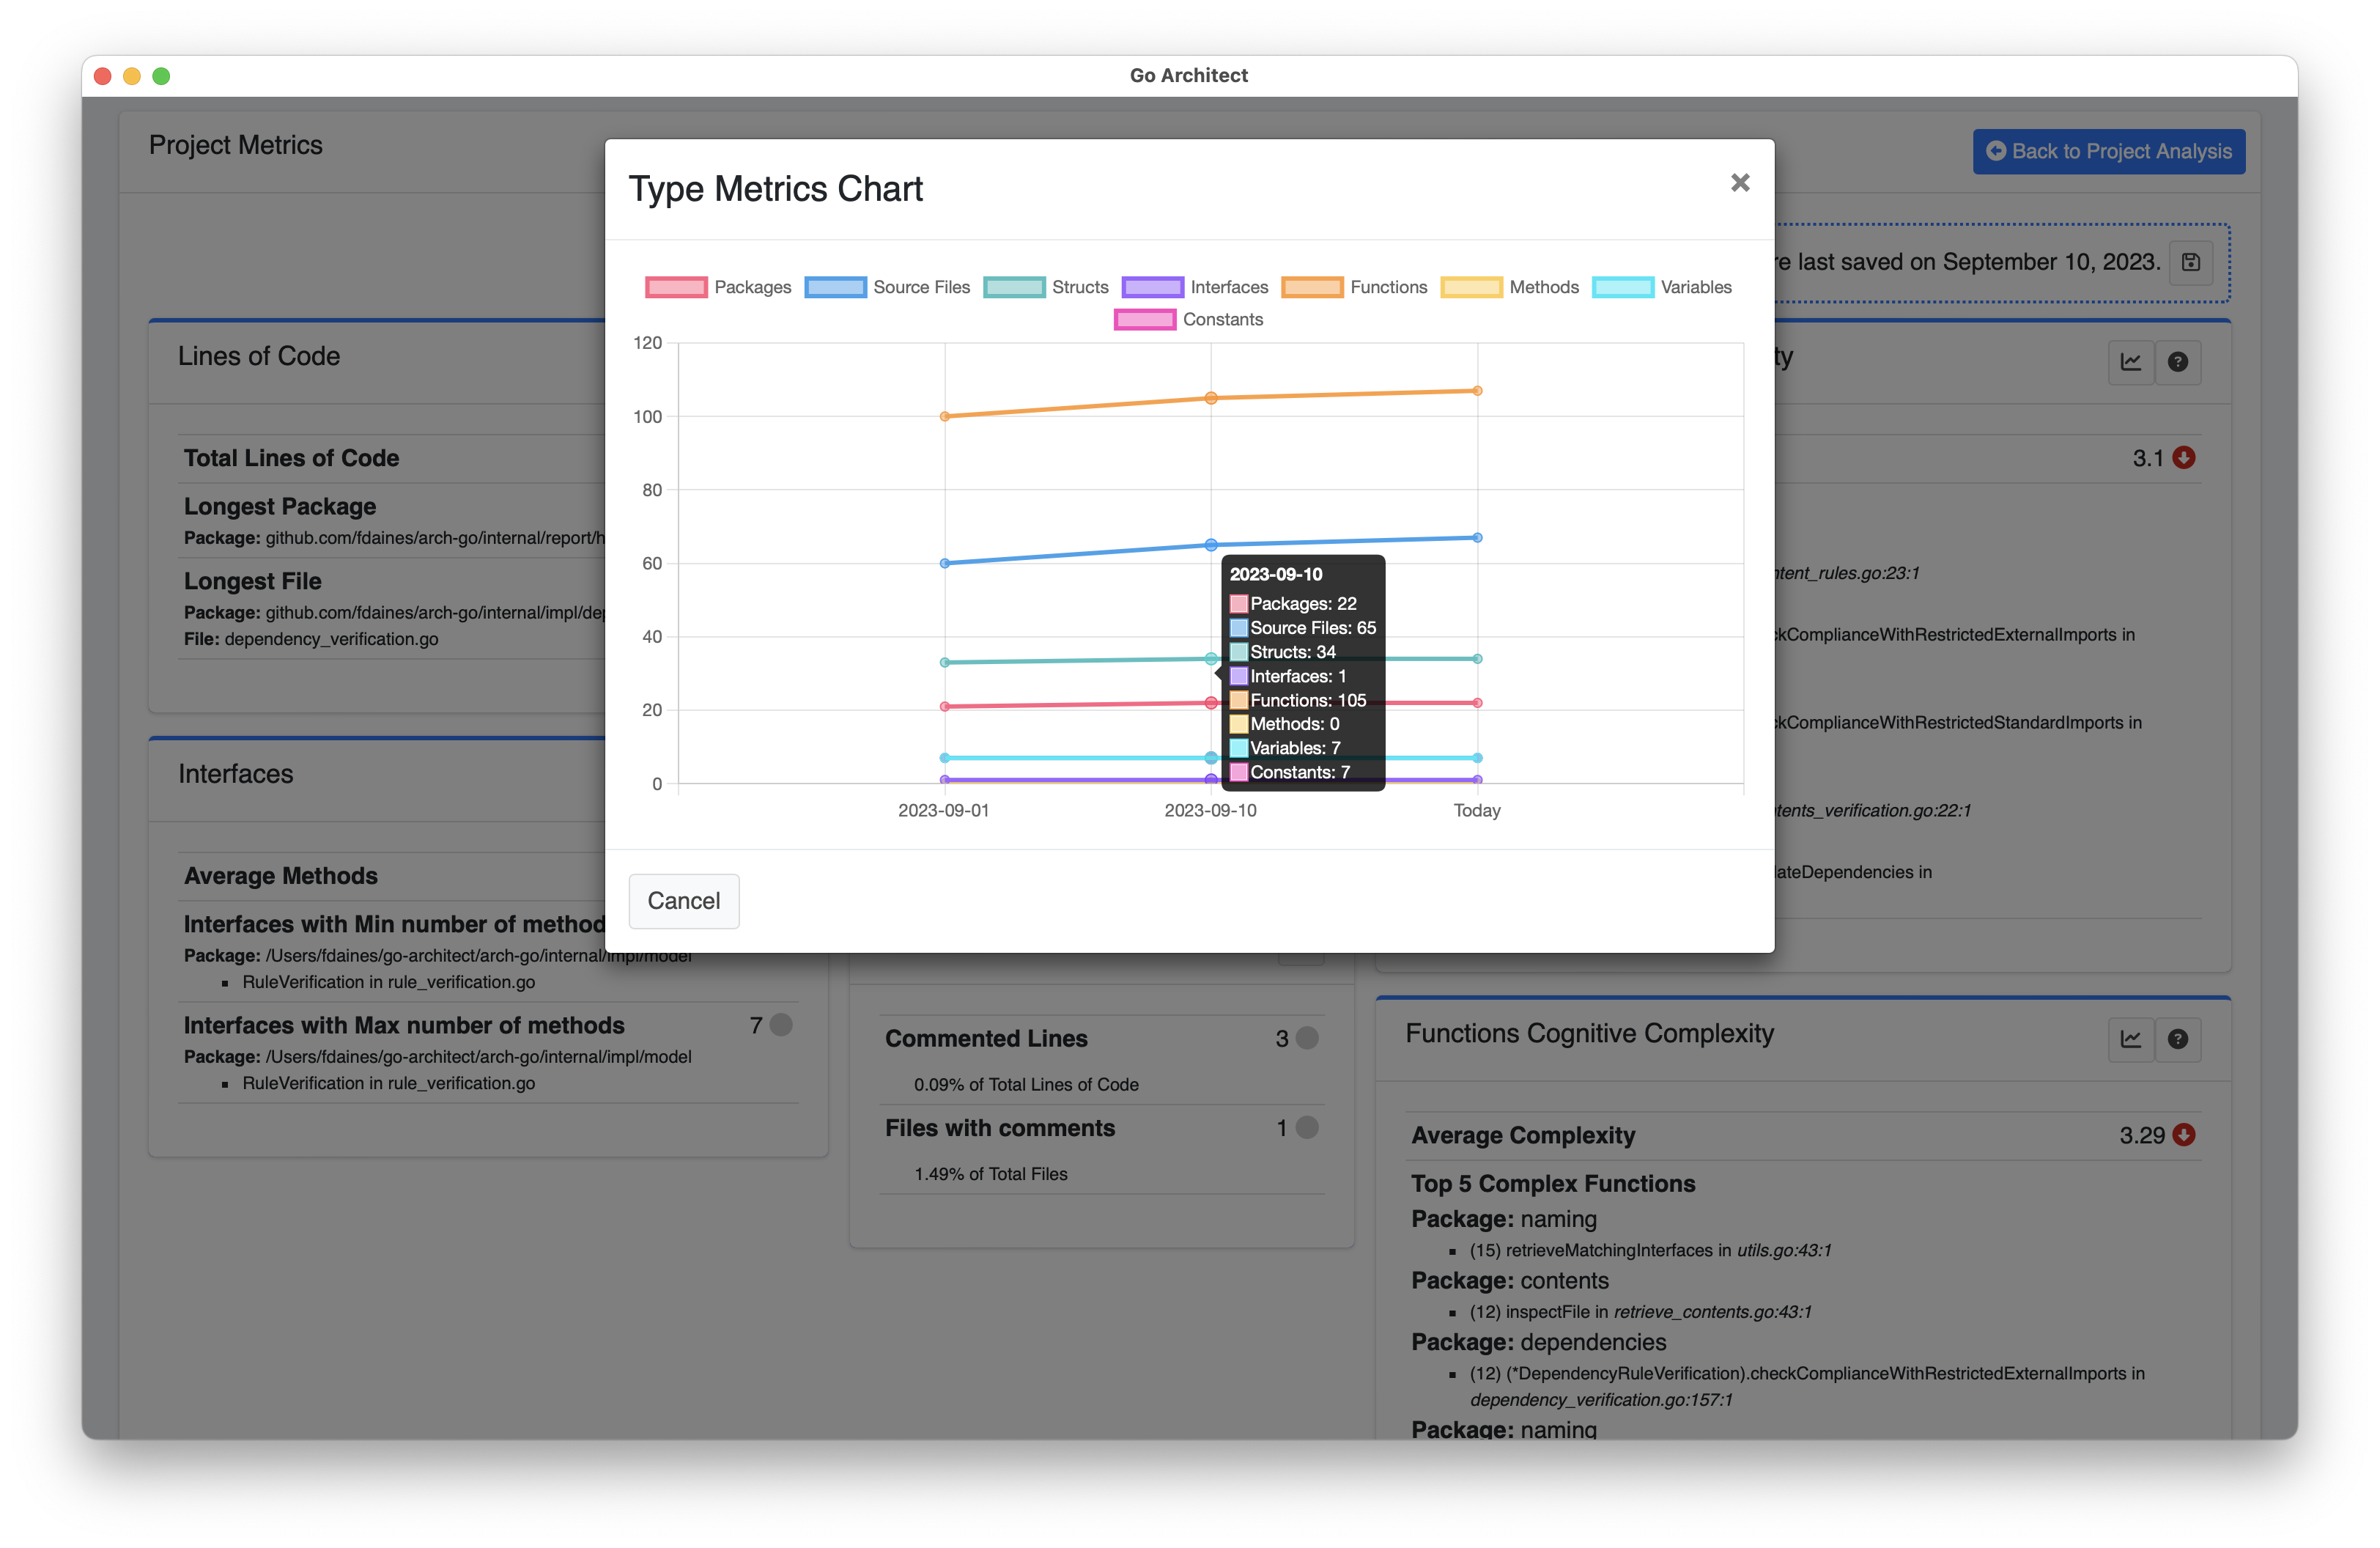
You can see the evolution for a specific group of metrics clicking the button in each metrics card. For example, the following image shows the historical chart for the Types metrics.
To close this Tool, click on Back to Project Analysis button.
Dependency Graph
The Dependency Graph is a visual representation that illustrates the relationships and dependencies between packages in a software artifact. It helps developers and maintainers understand packages relations, which is crucial for managing and building complex software projects.
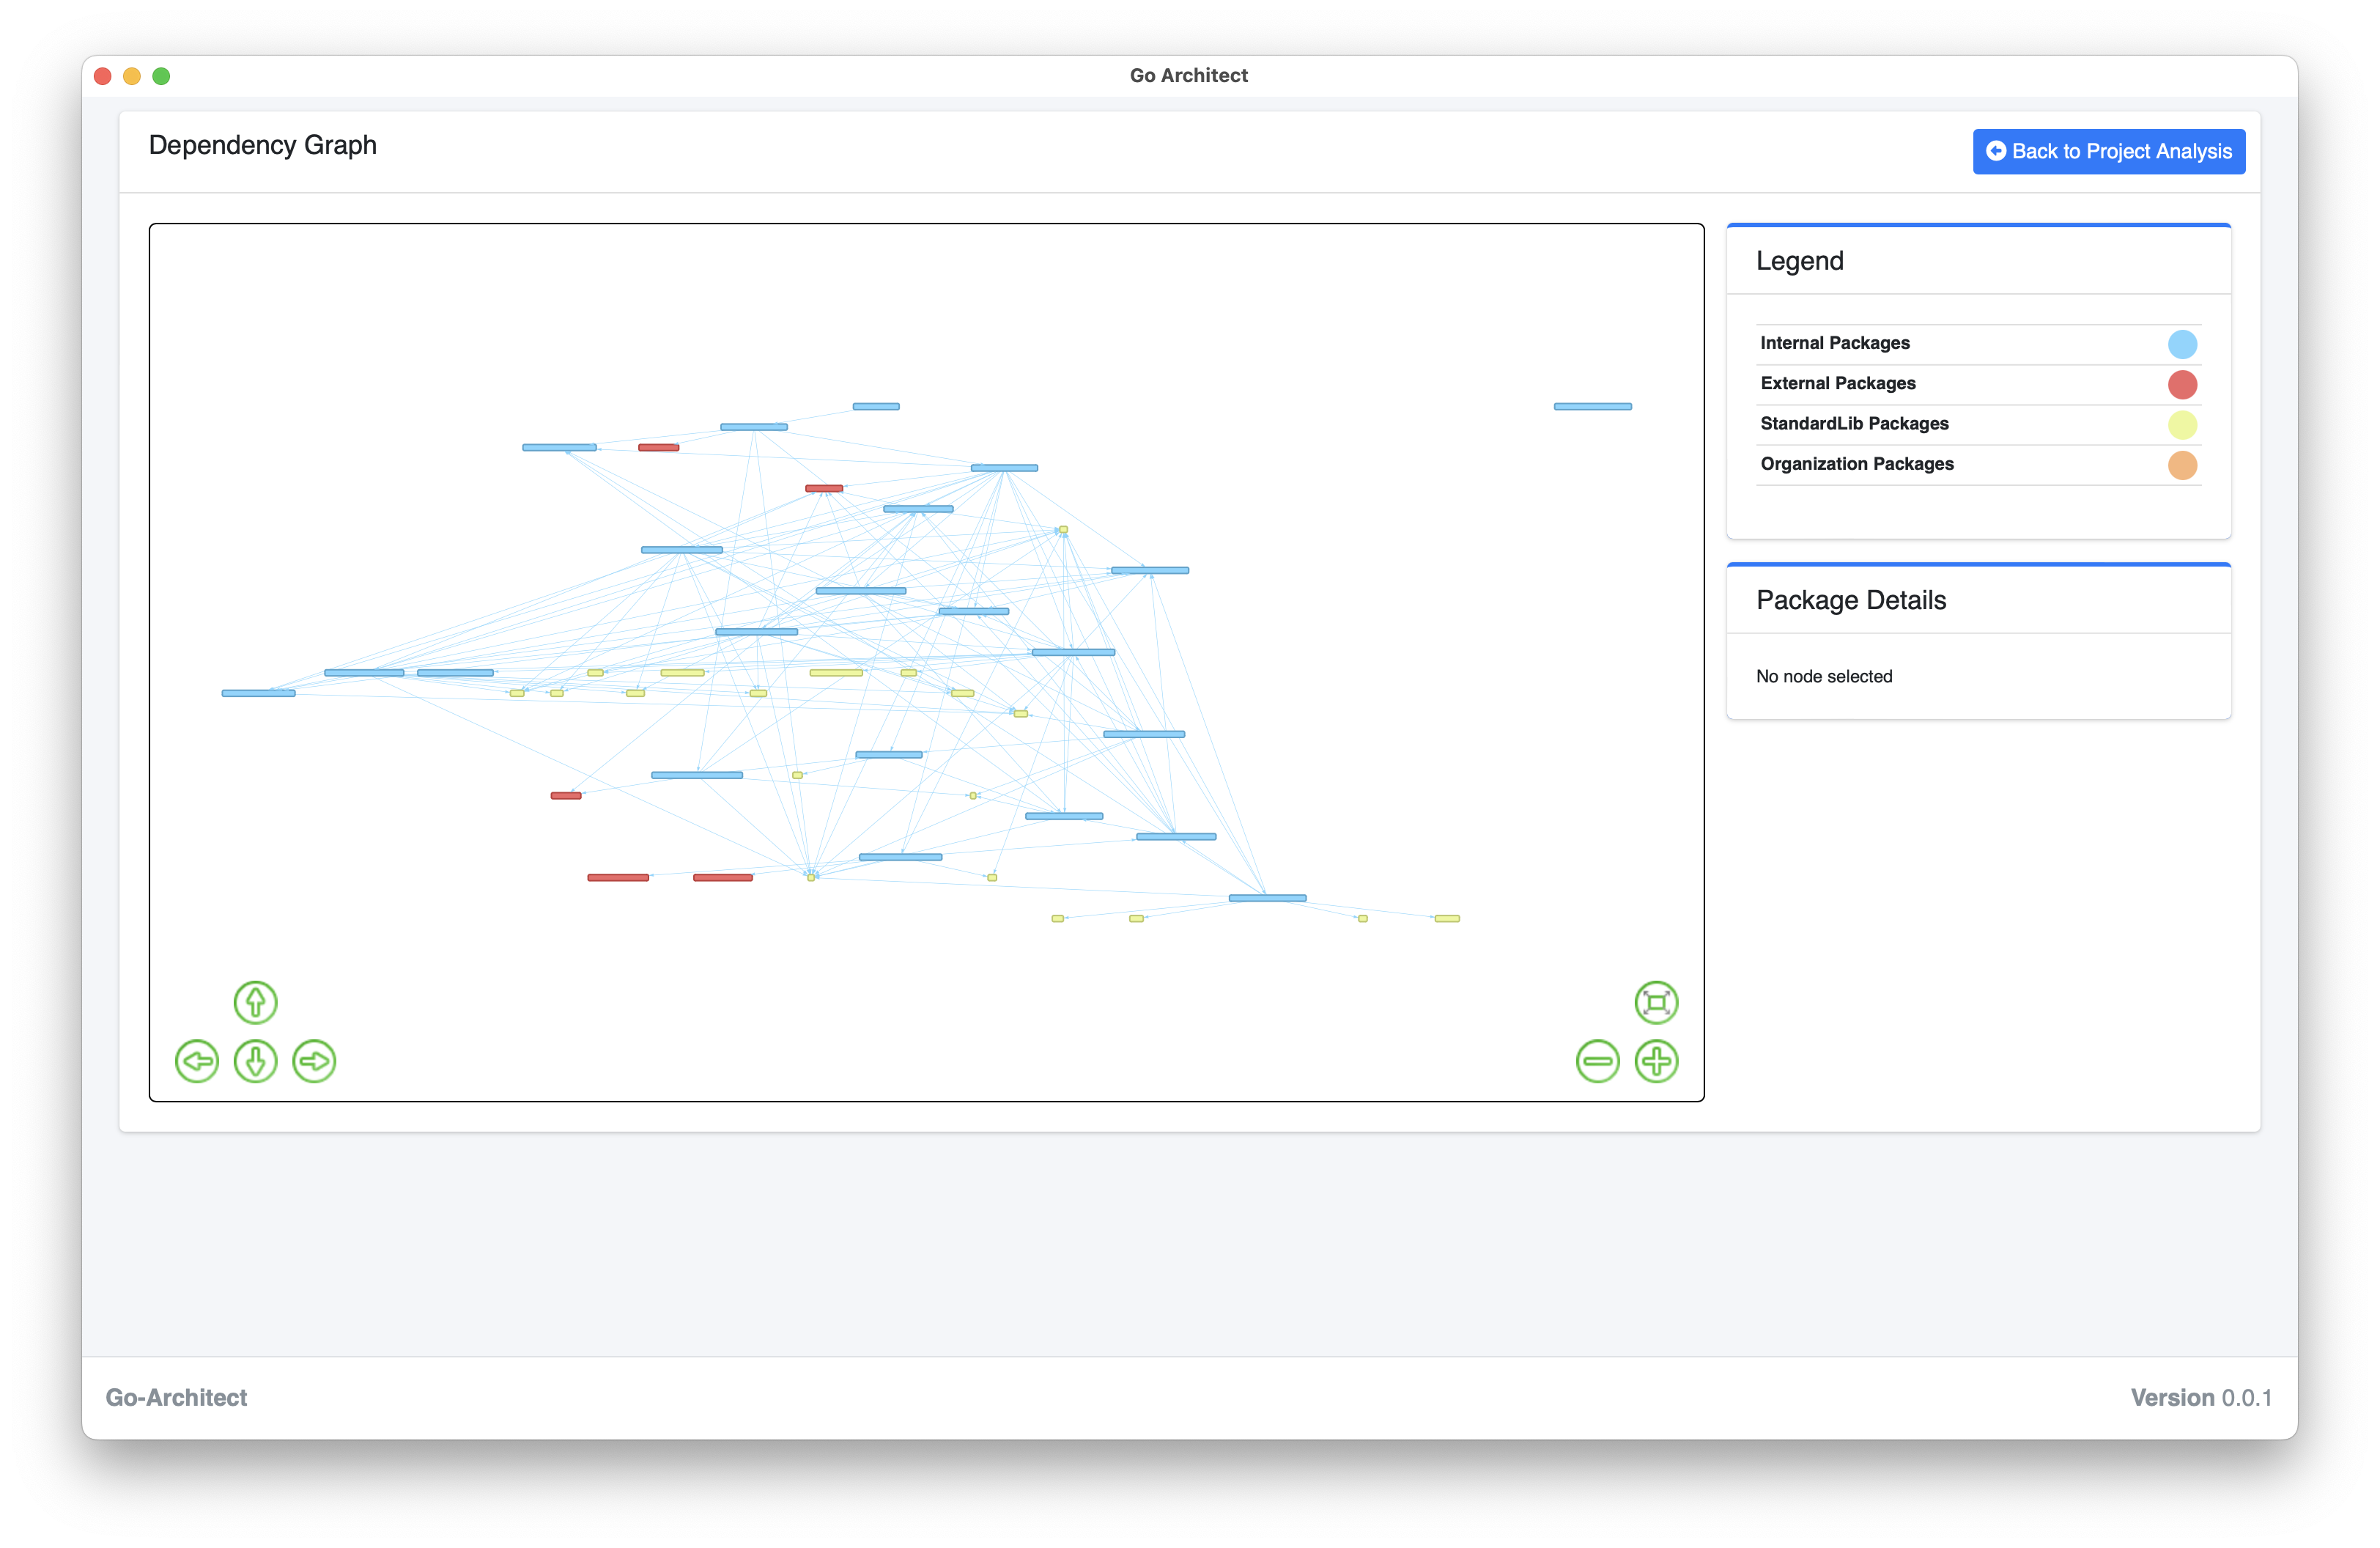
You can zoom in and zoom out the dependency graph using the widget controls, and if you click on a specific package, then it details will be displayed on the Package Details Widget.
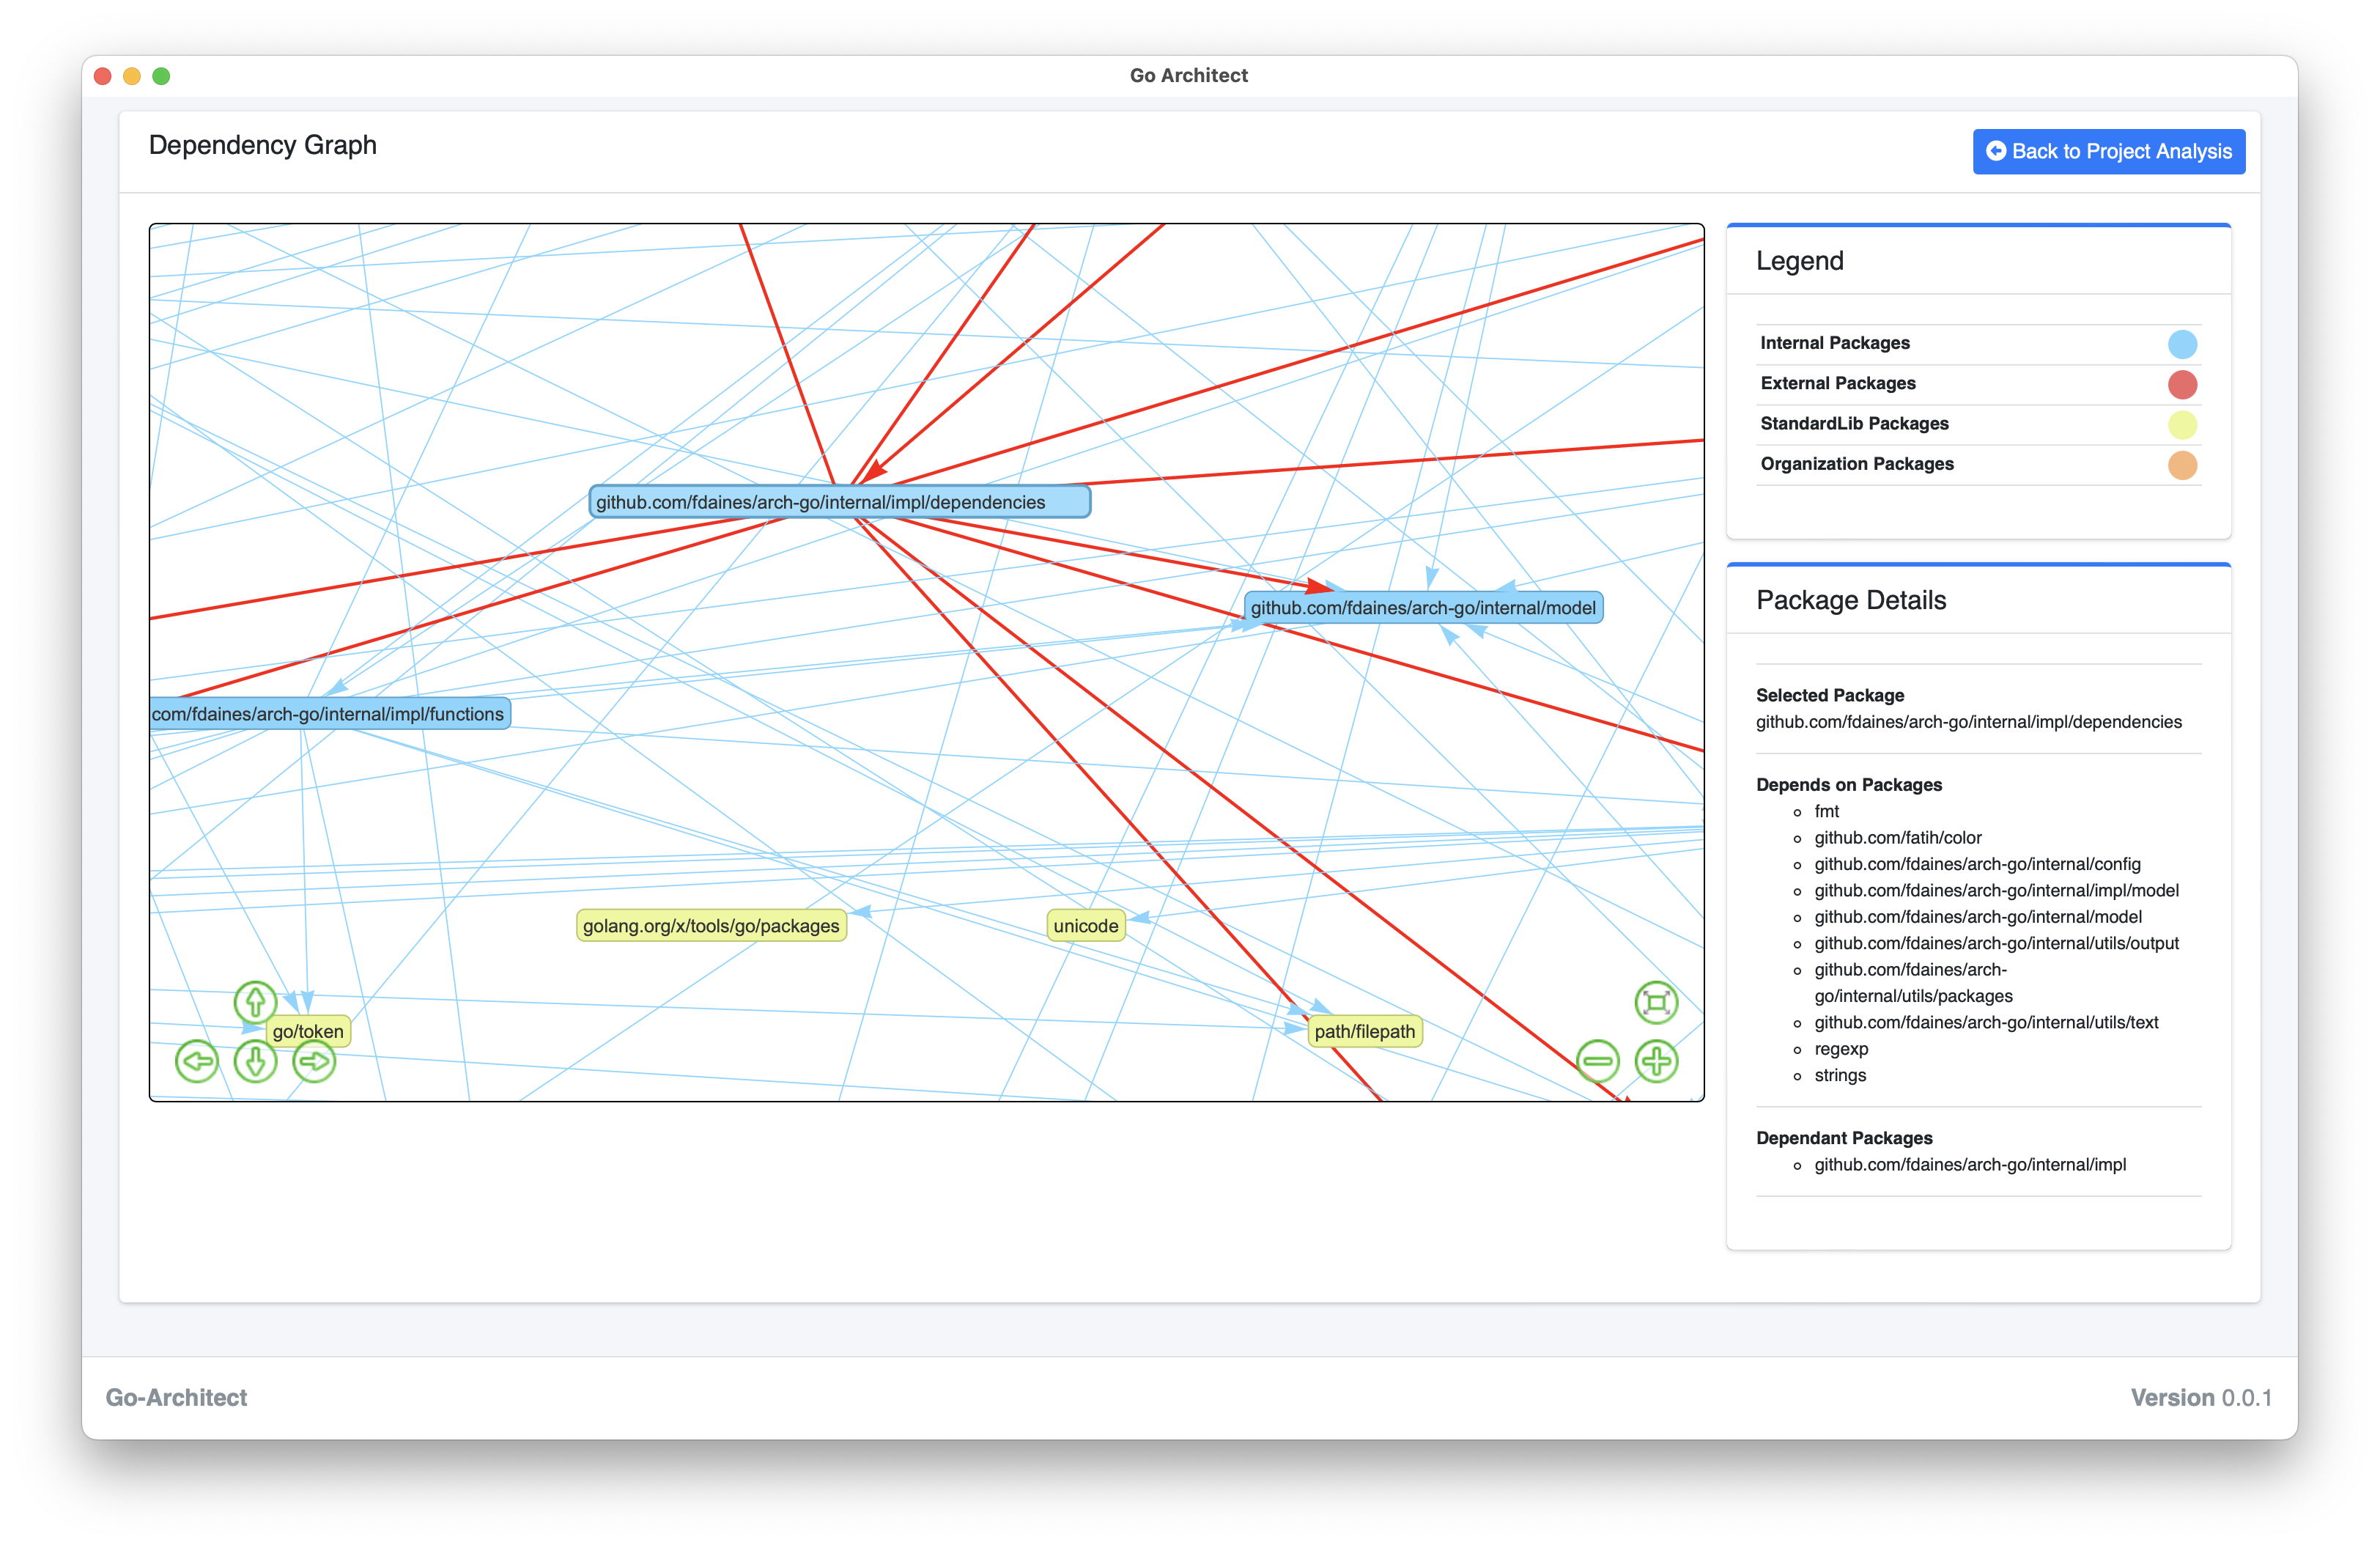
The selected package details includes:
- Selected Package: The name of the selected package.
- Depends on Packages: Packages used by the selected package.
- Dependant Packages: Packages that uses the selected package.
To close this Tool, click on Back to Project Analysis button.
Dependency Structure Matrix
The Dependency Structure Matrix (DSM) Tool is a graphical representation used to visualize and analyze dependencies between packages in a Project.
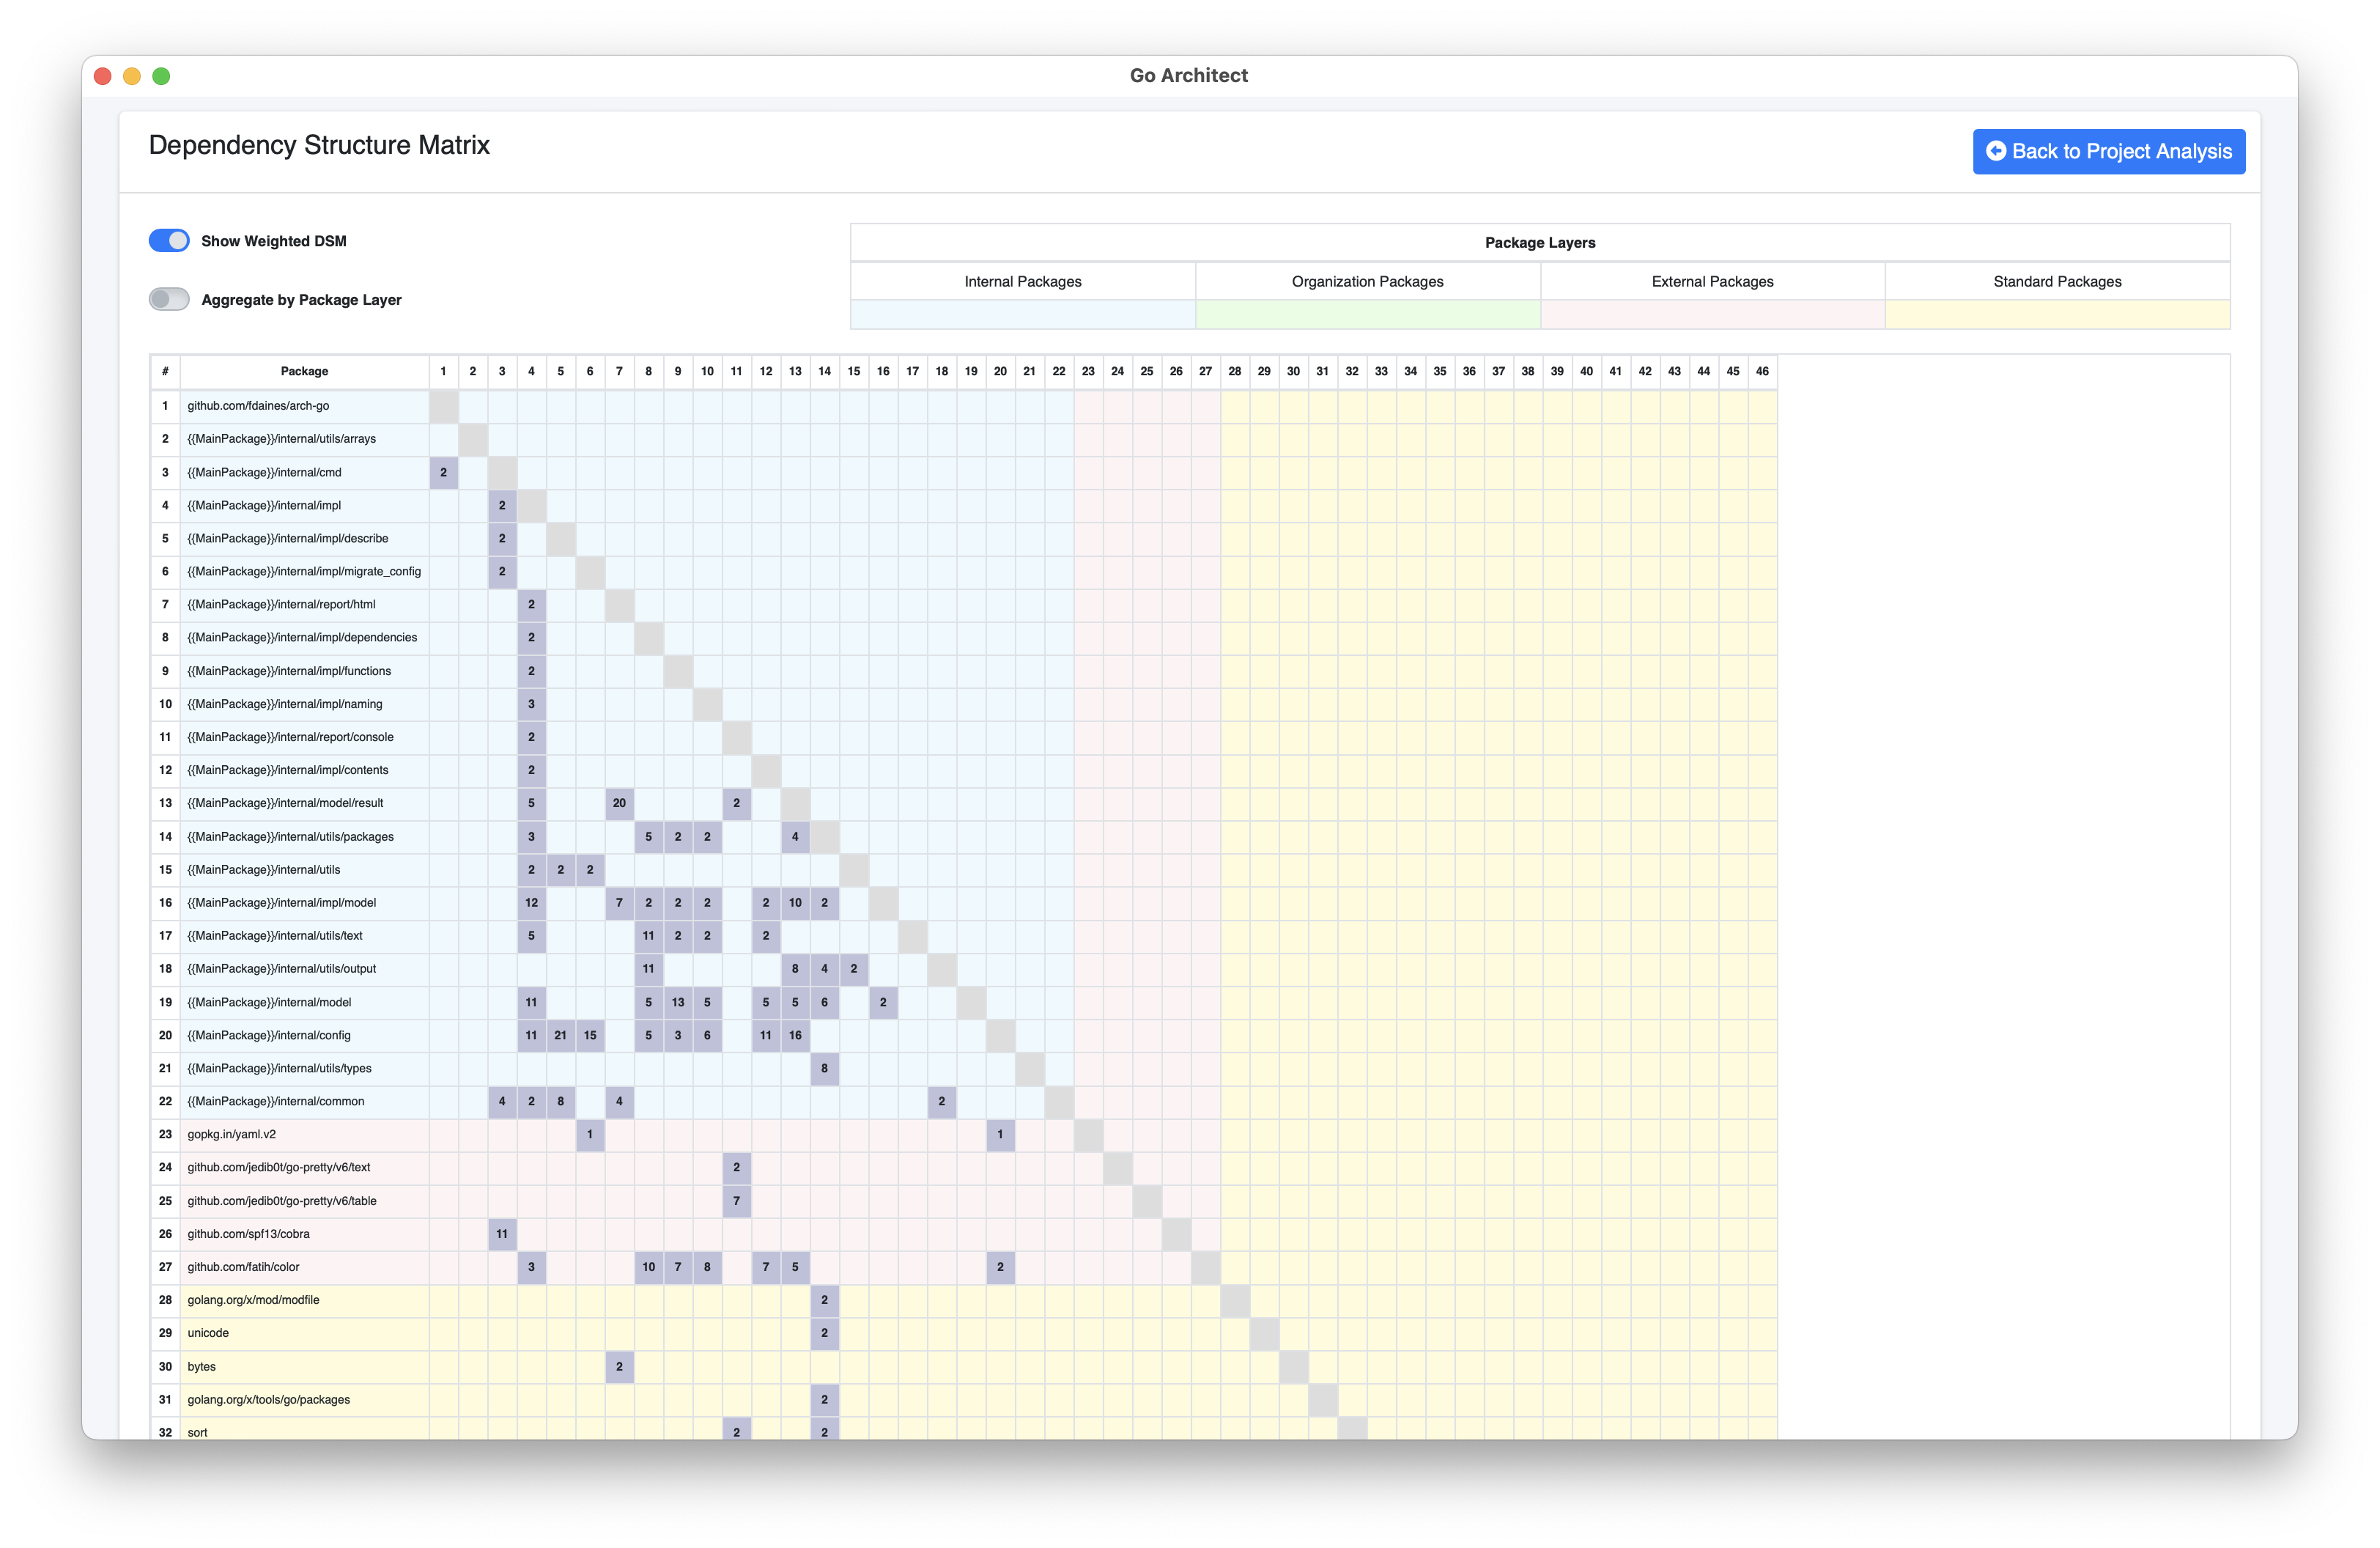
To close this Tool, click on Back to Project Analysis button.
Instability & Abstractness
The Instability v/s Abstractness Graph is a powerful tool used to analyze how maintainable, flexible, and easy to understand is an artifact.
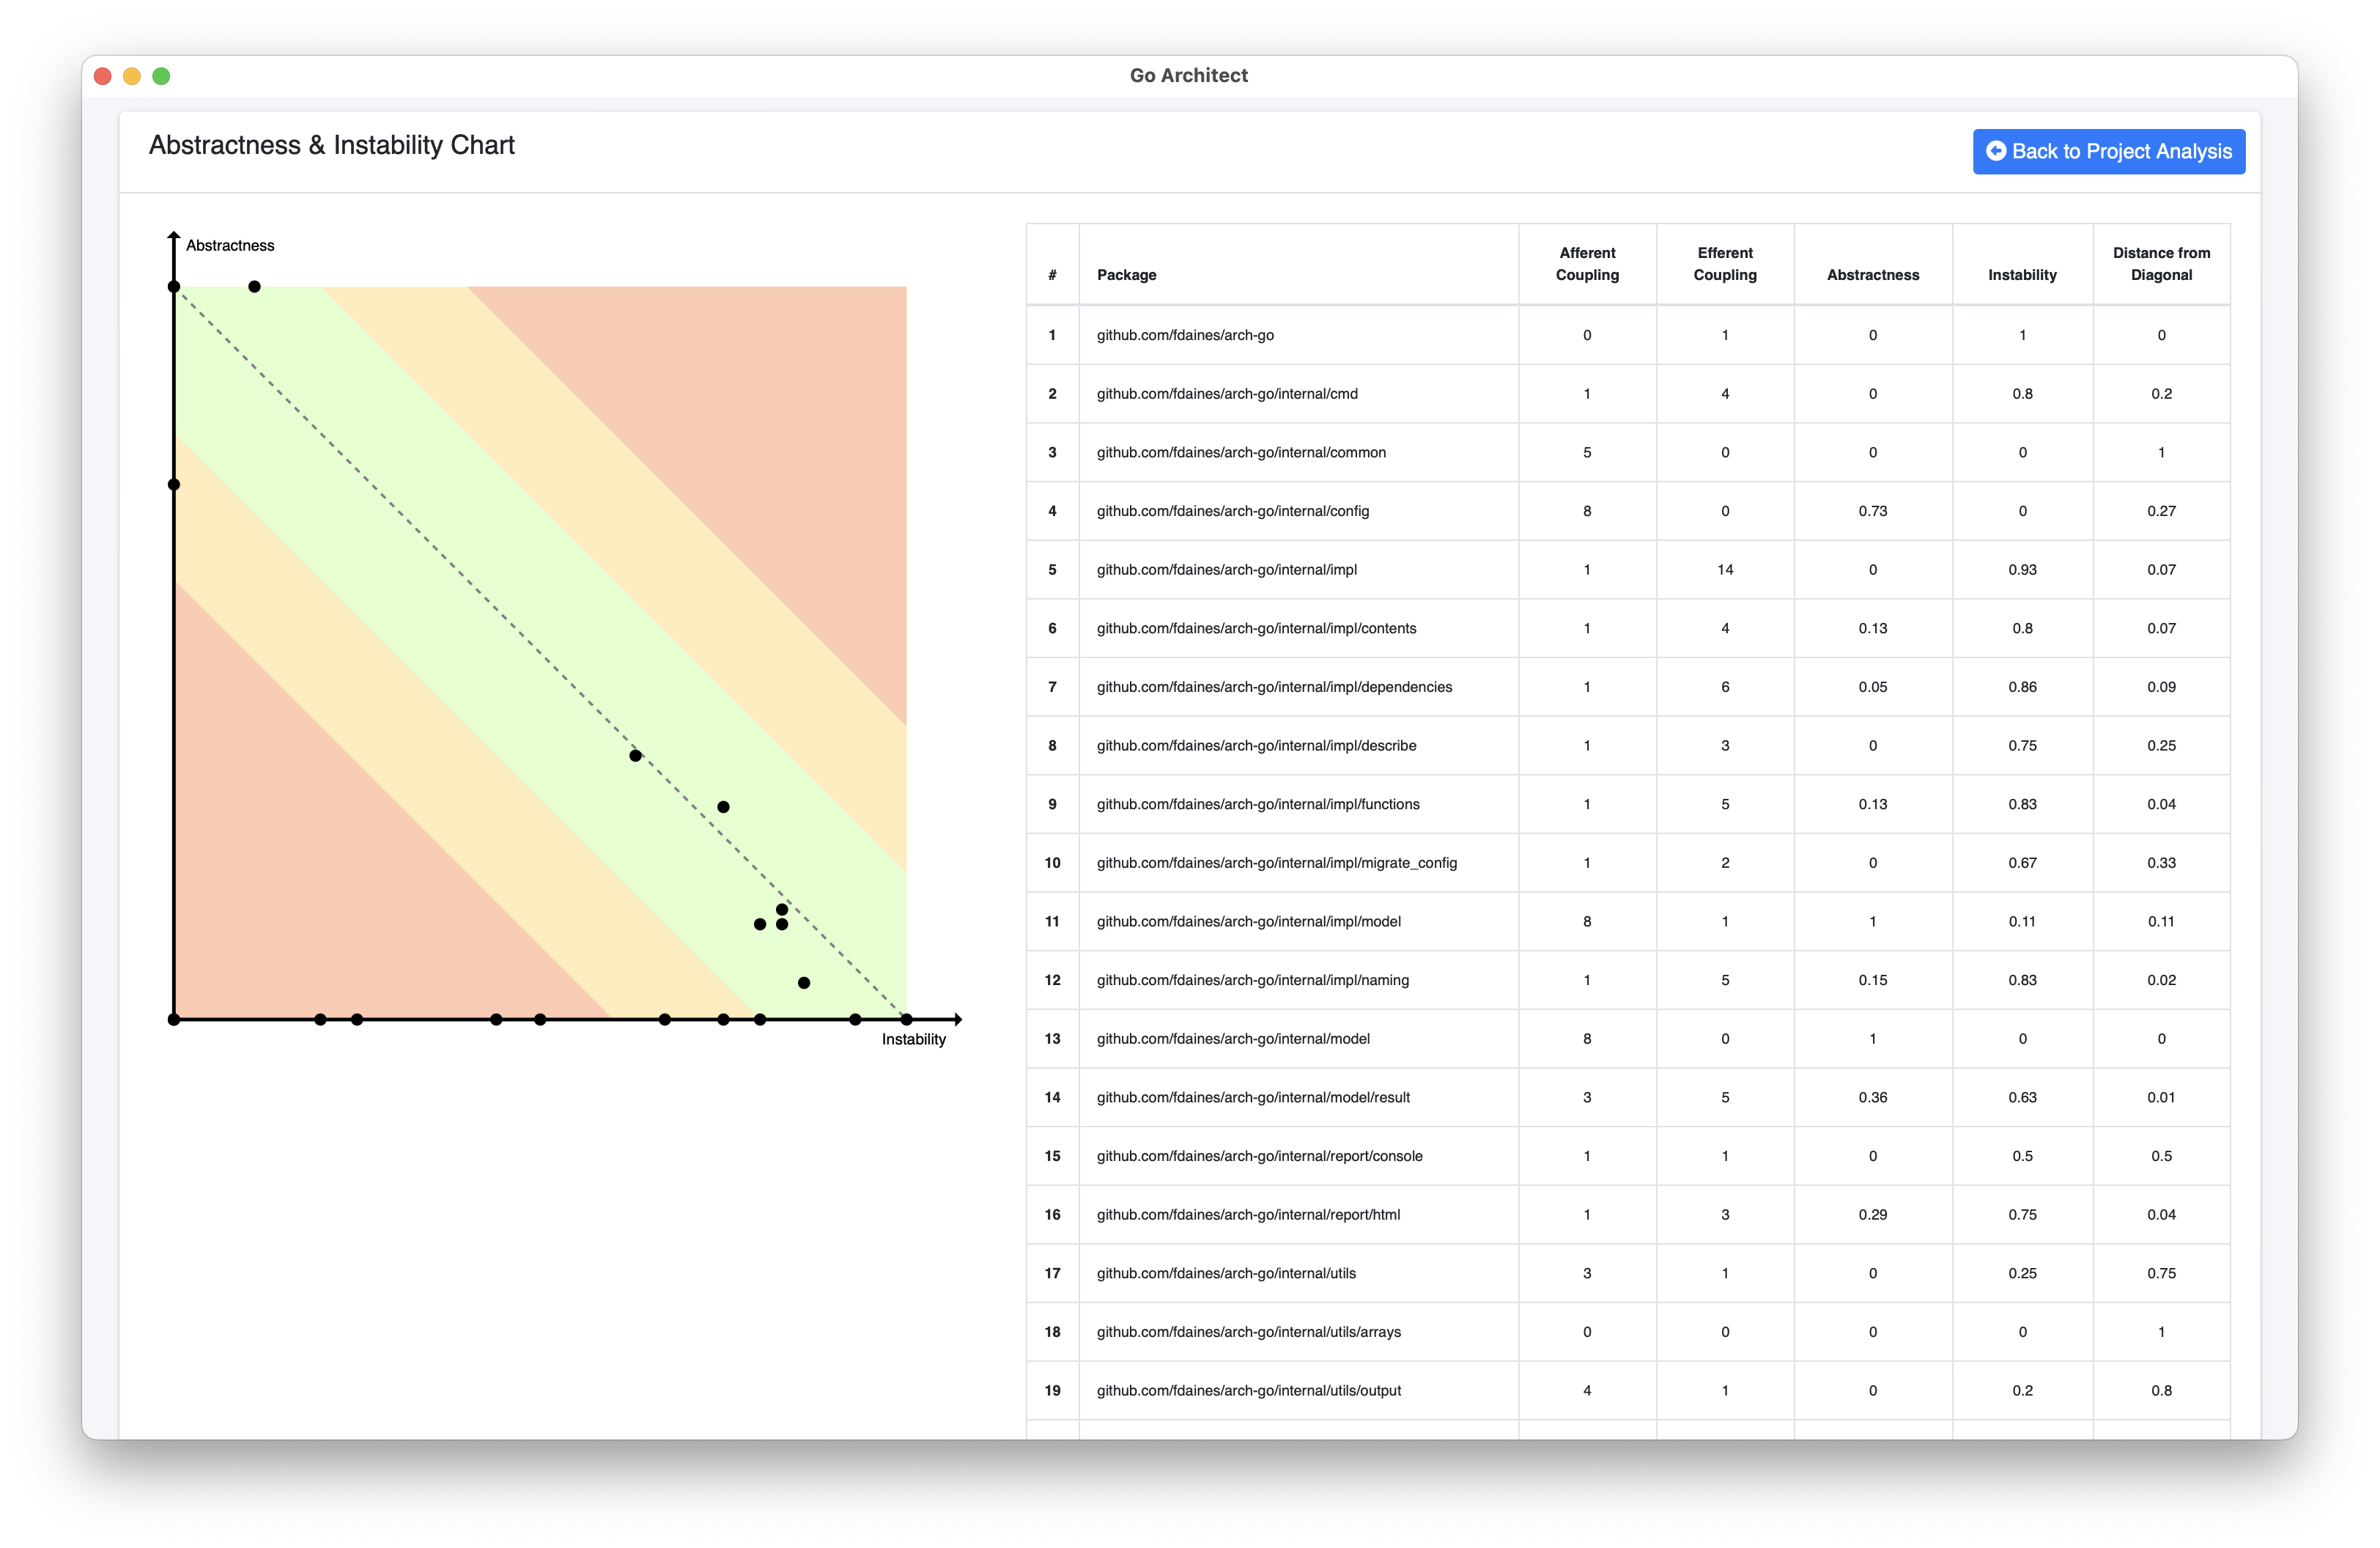
To close this Tool, click on Back to Project Analysis button.
Dependency Coupling
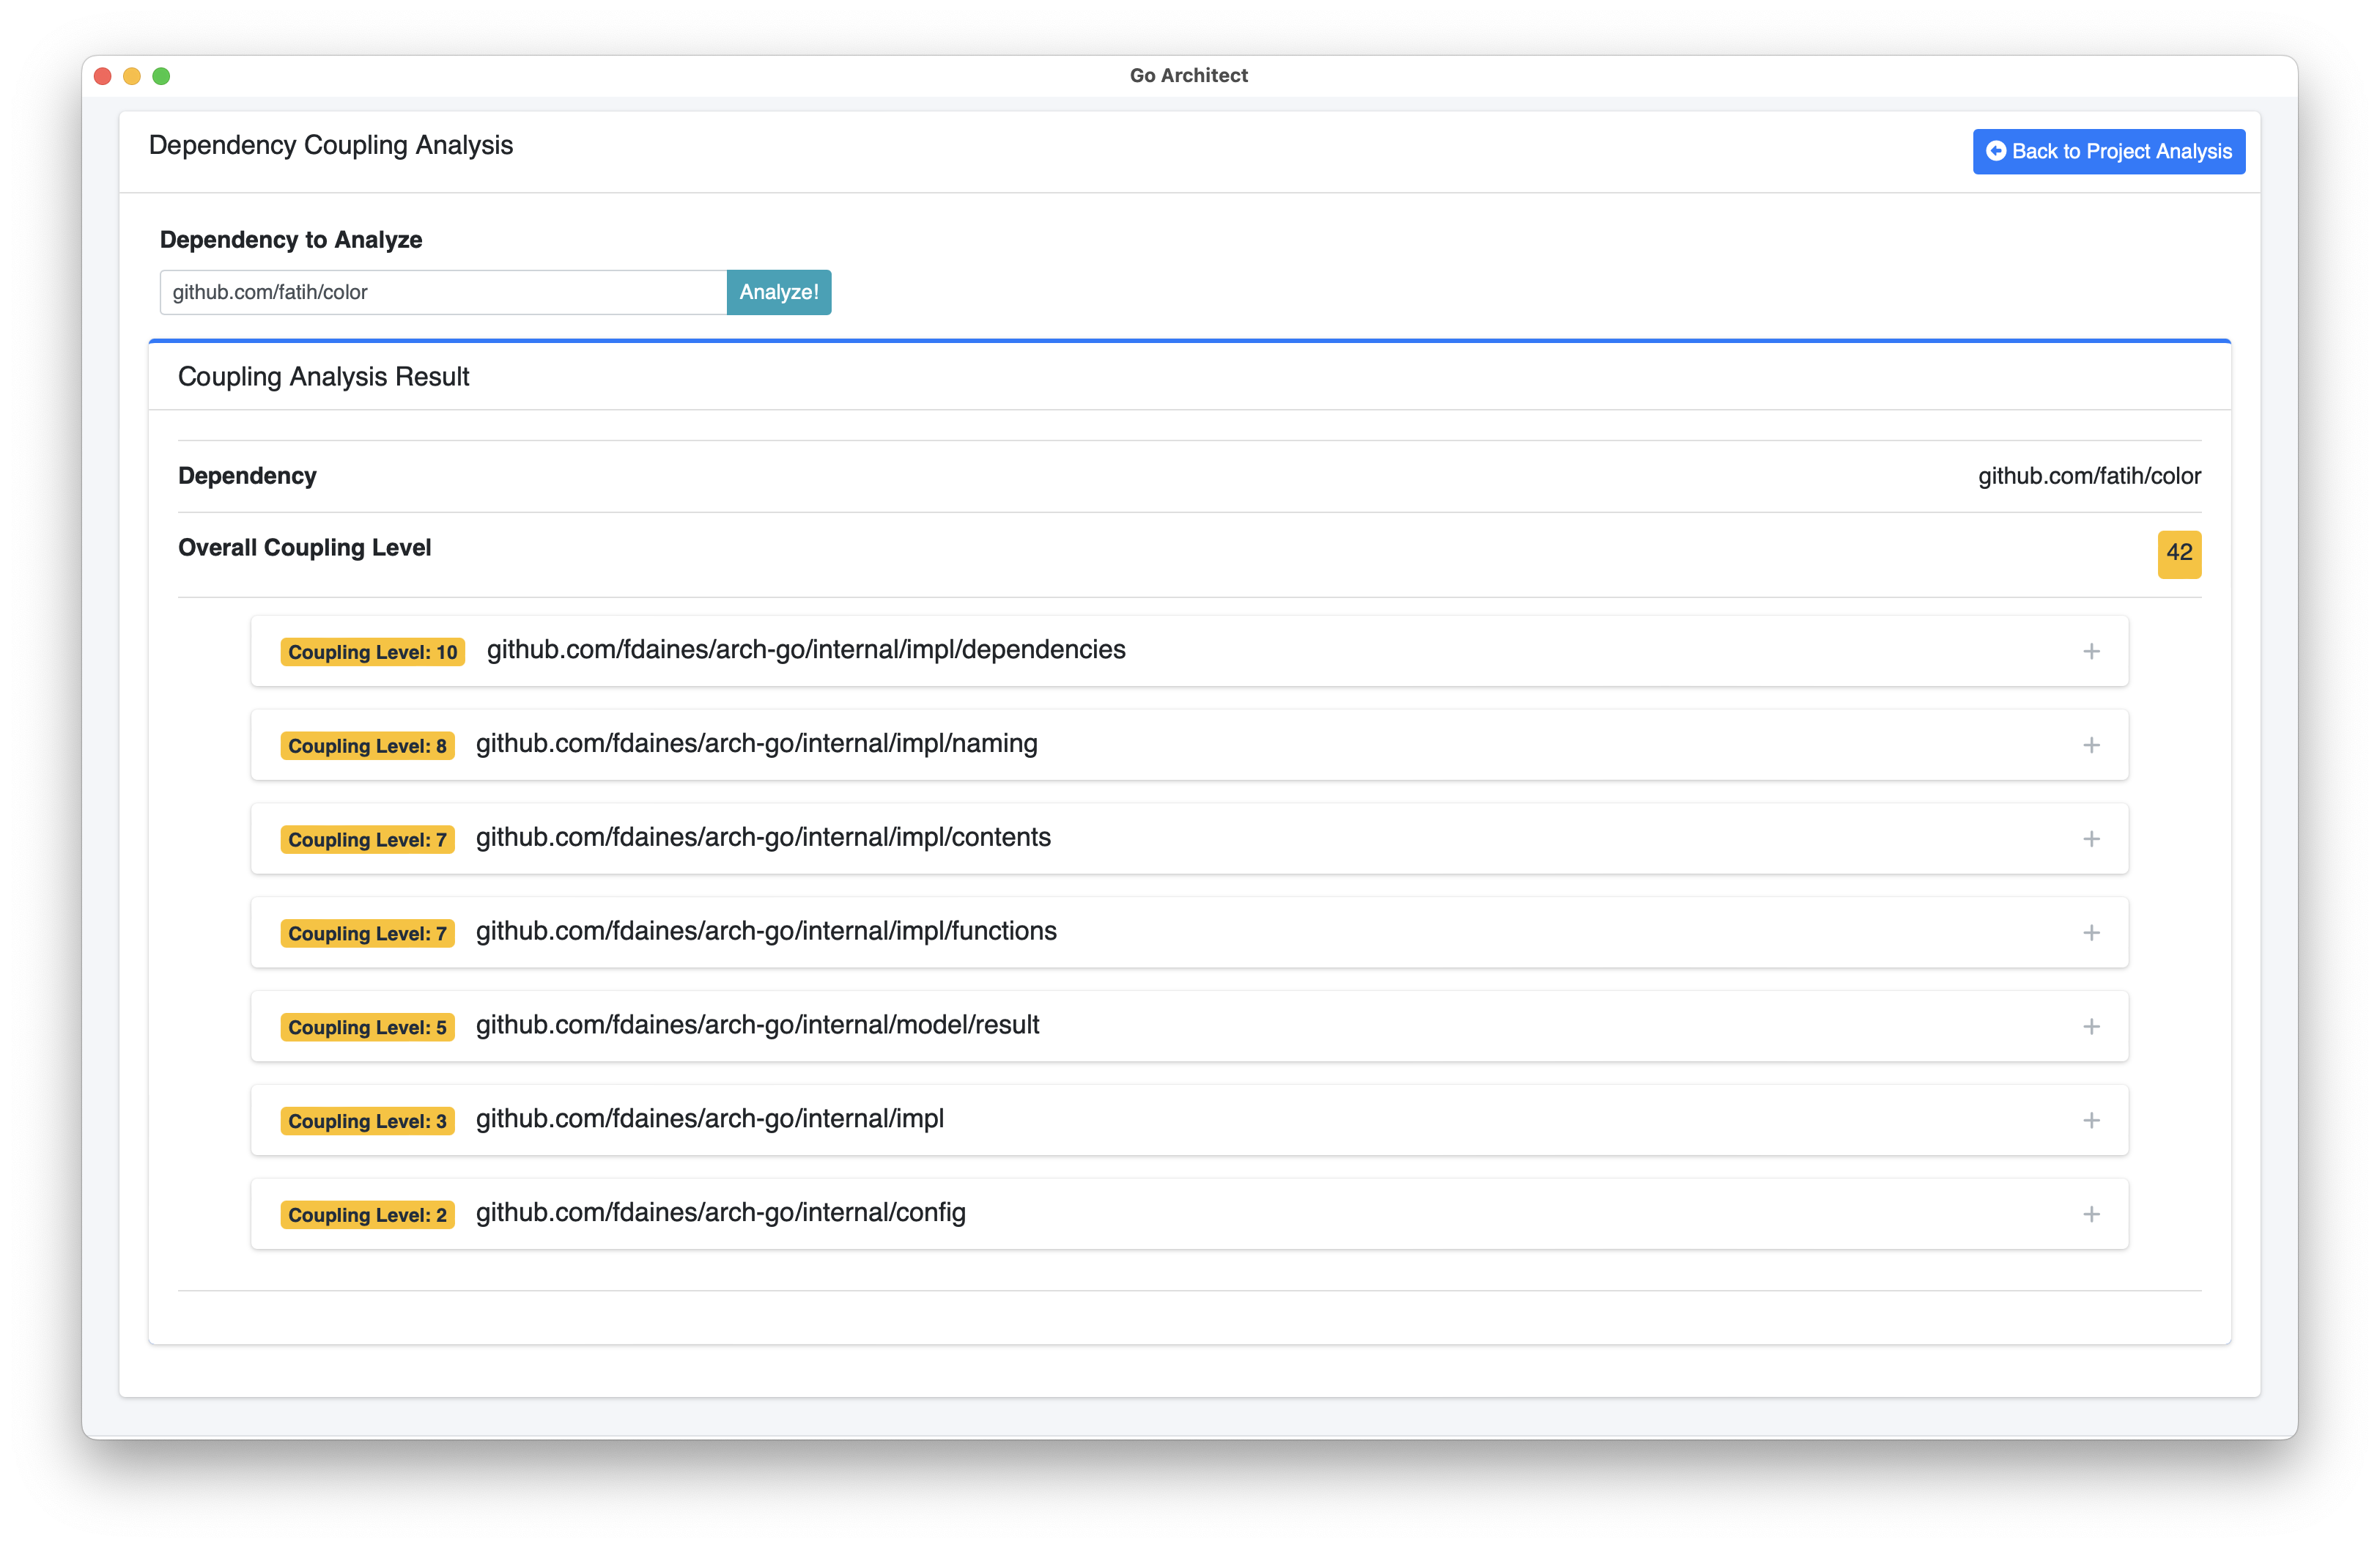
Dependency Coupling Tool helps us to detect how coupled is our artifact with a specific dependency, that can be an internal, same organization, external or a standard package.
The next image represents the coupling level between Arch-Go and the github.com/fatih/color package
Additionally, this tool allows us to navigate over the file that uses the dependency, showing the file source code and highlighting the lines that include references to that dependency.
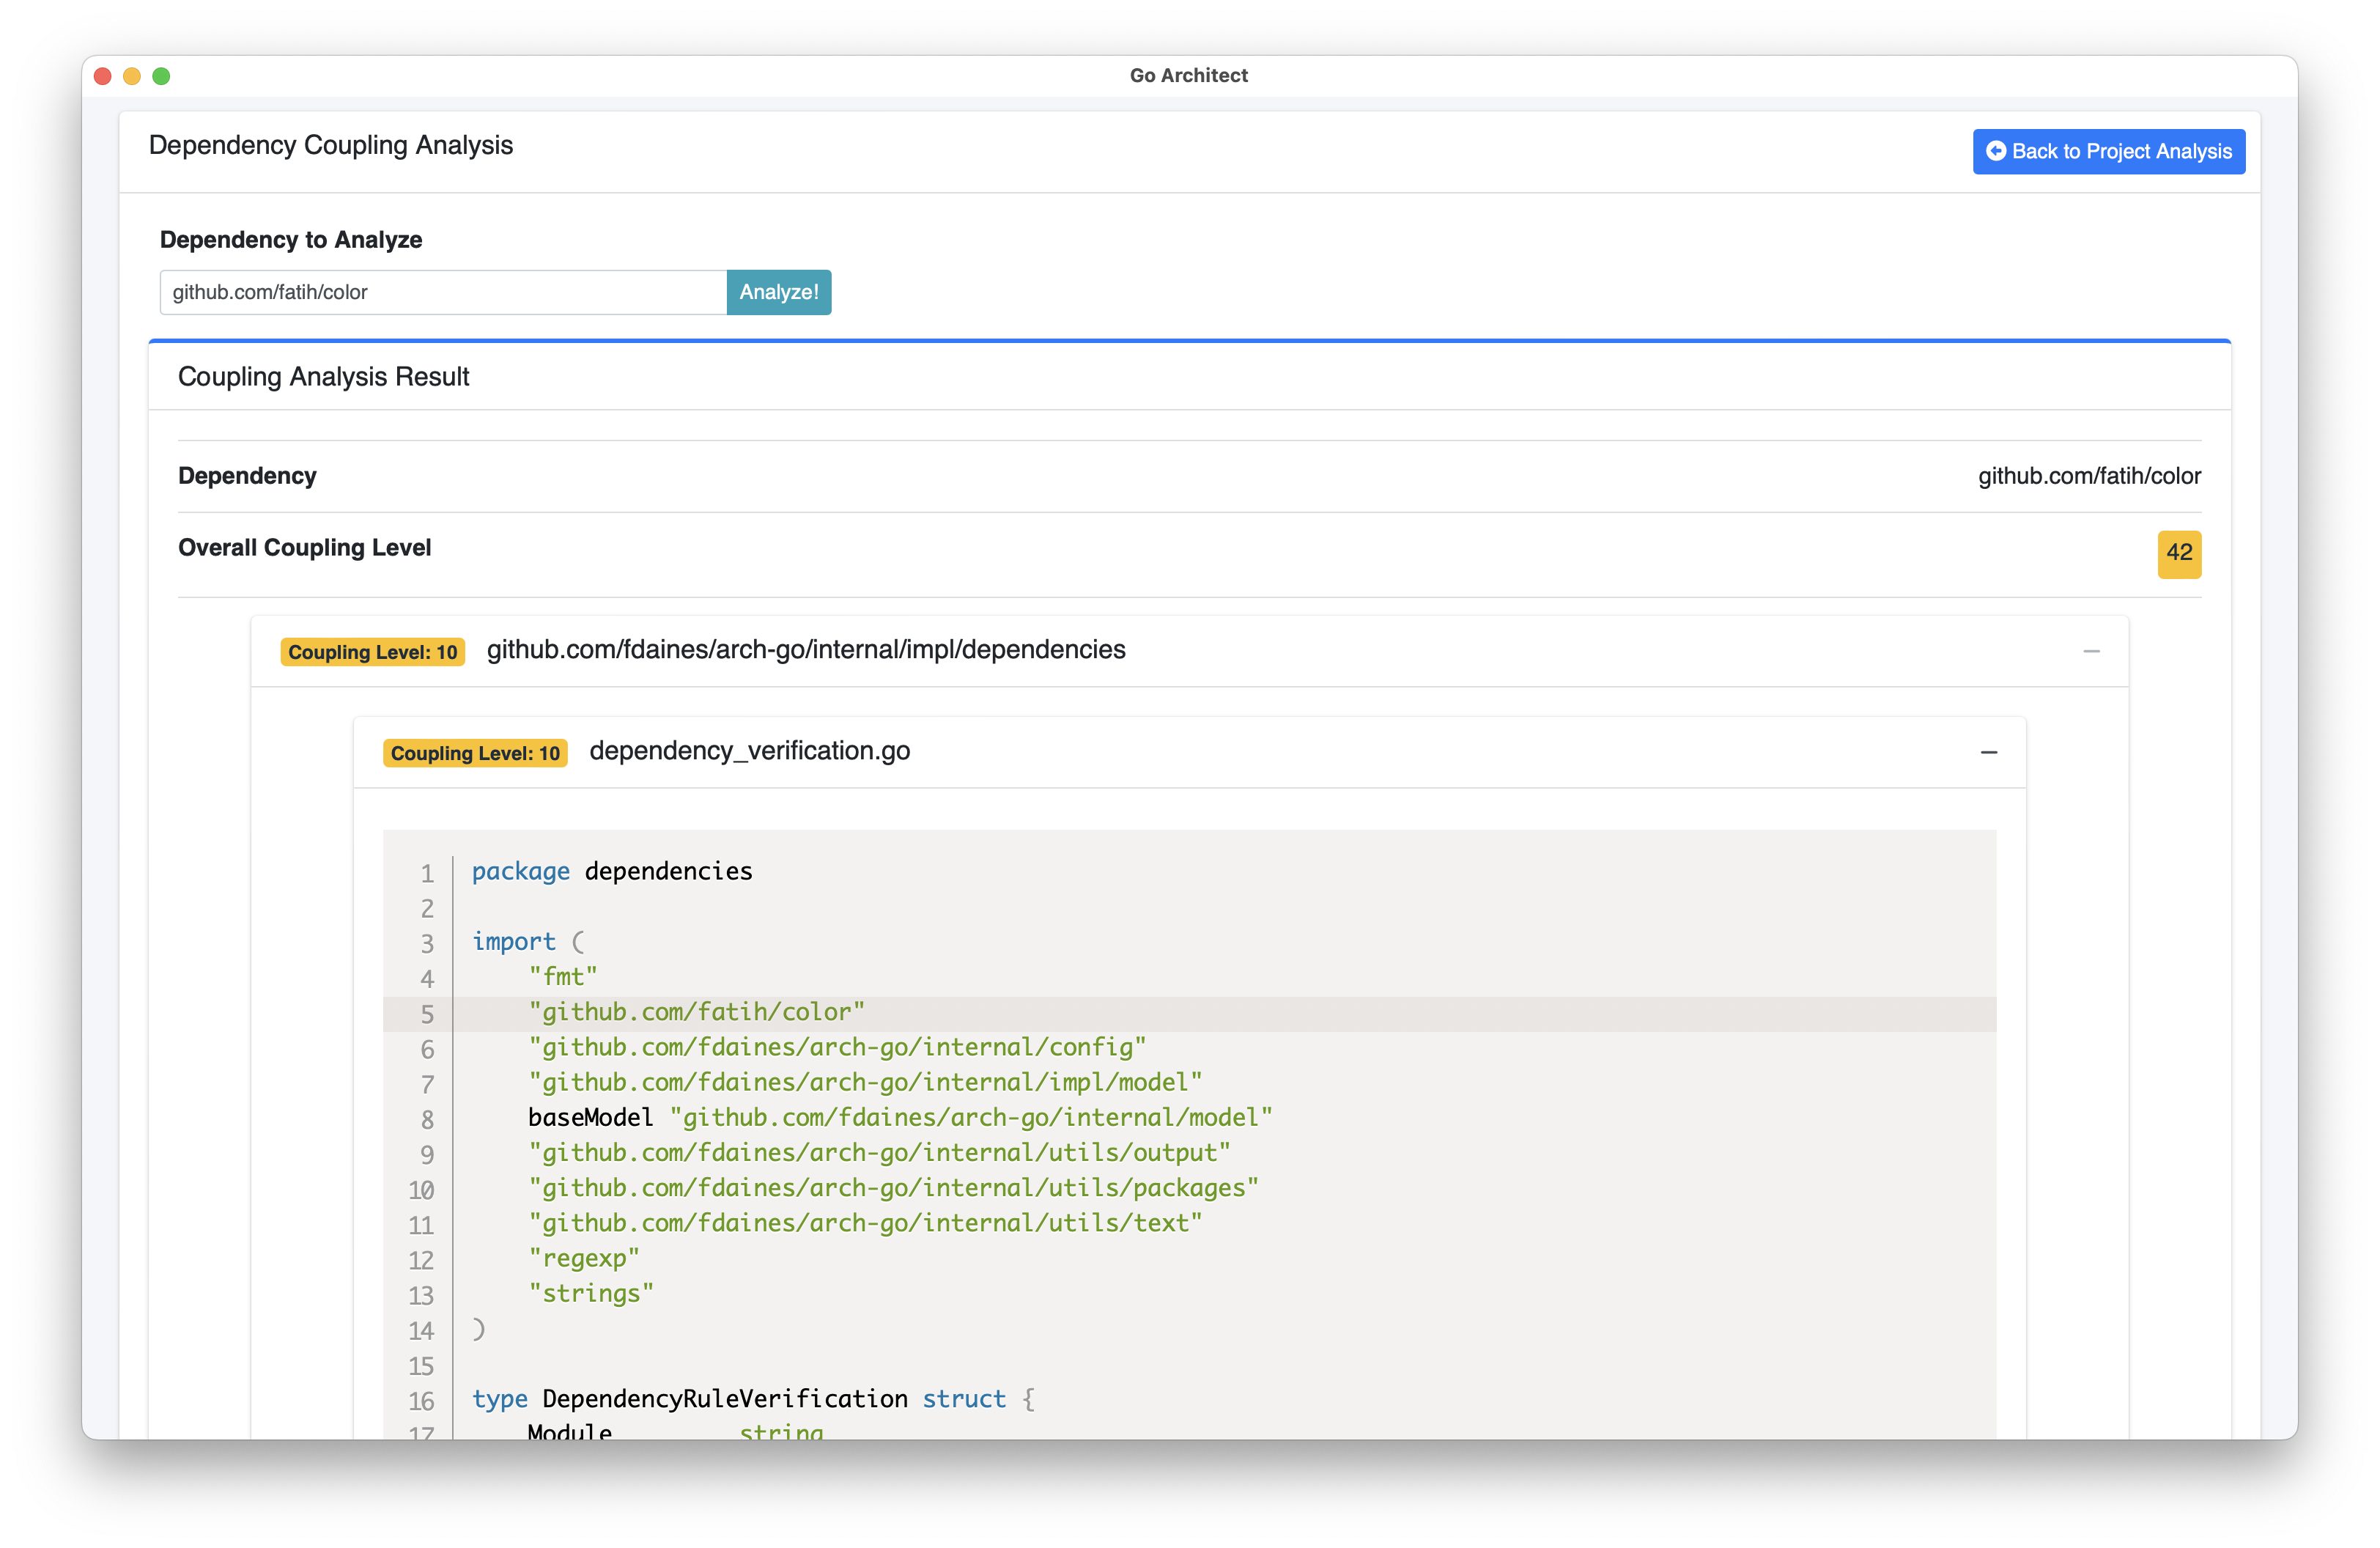
To close this Tool, click on Back to Project Analysis button.
VCS Analysis
This tool is focused on analyze the VCS history of the artifact, displaying some information about contributions and changes over packages/files in the artifact.
Note Go-Architect currently only supports VCS Analysis for Git repositories.
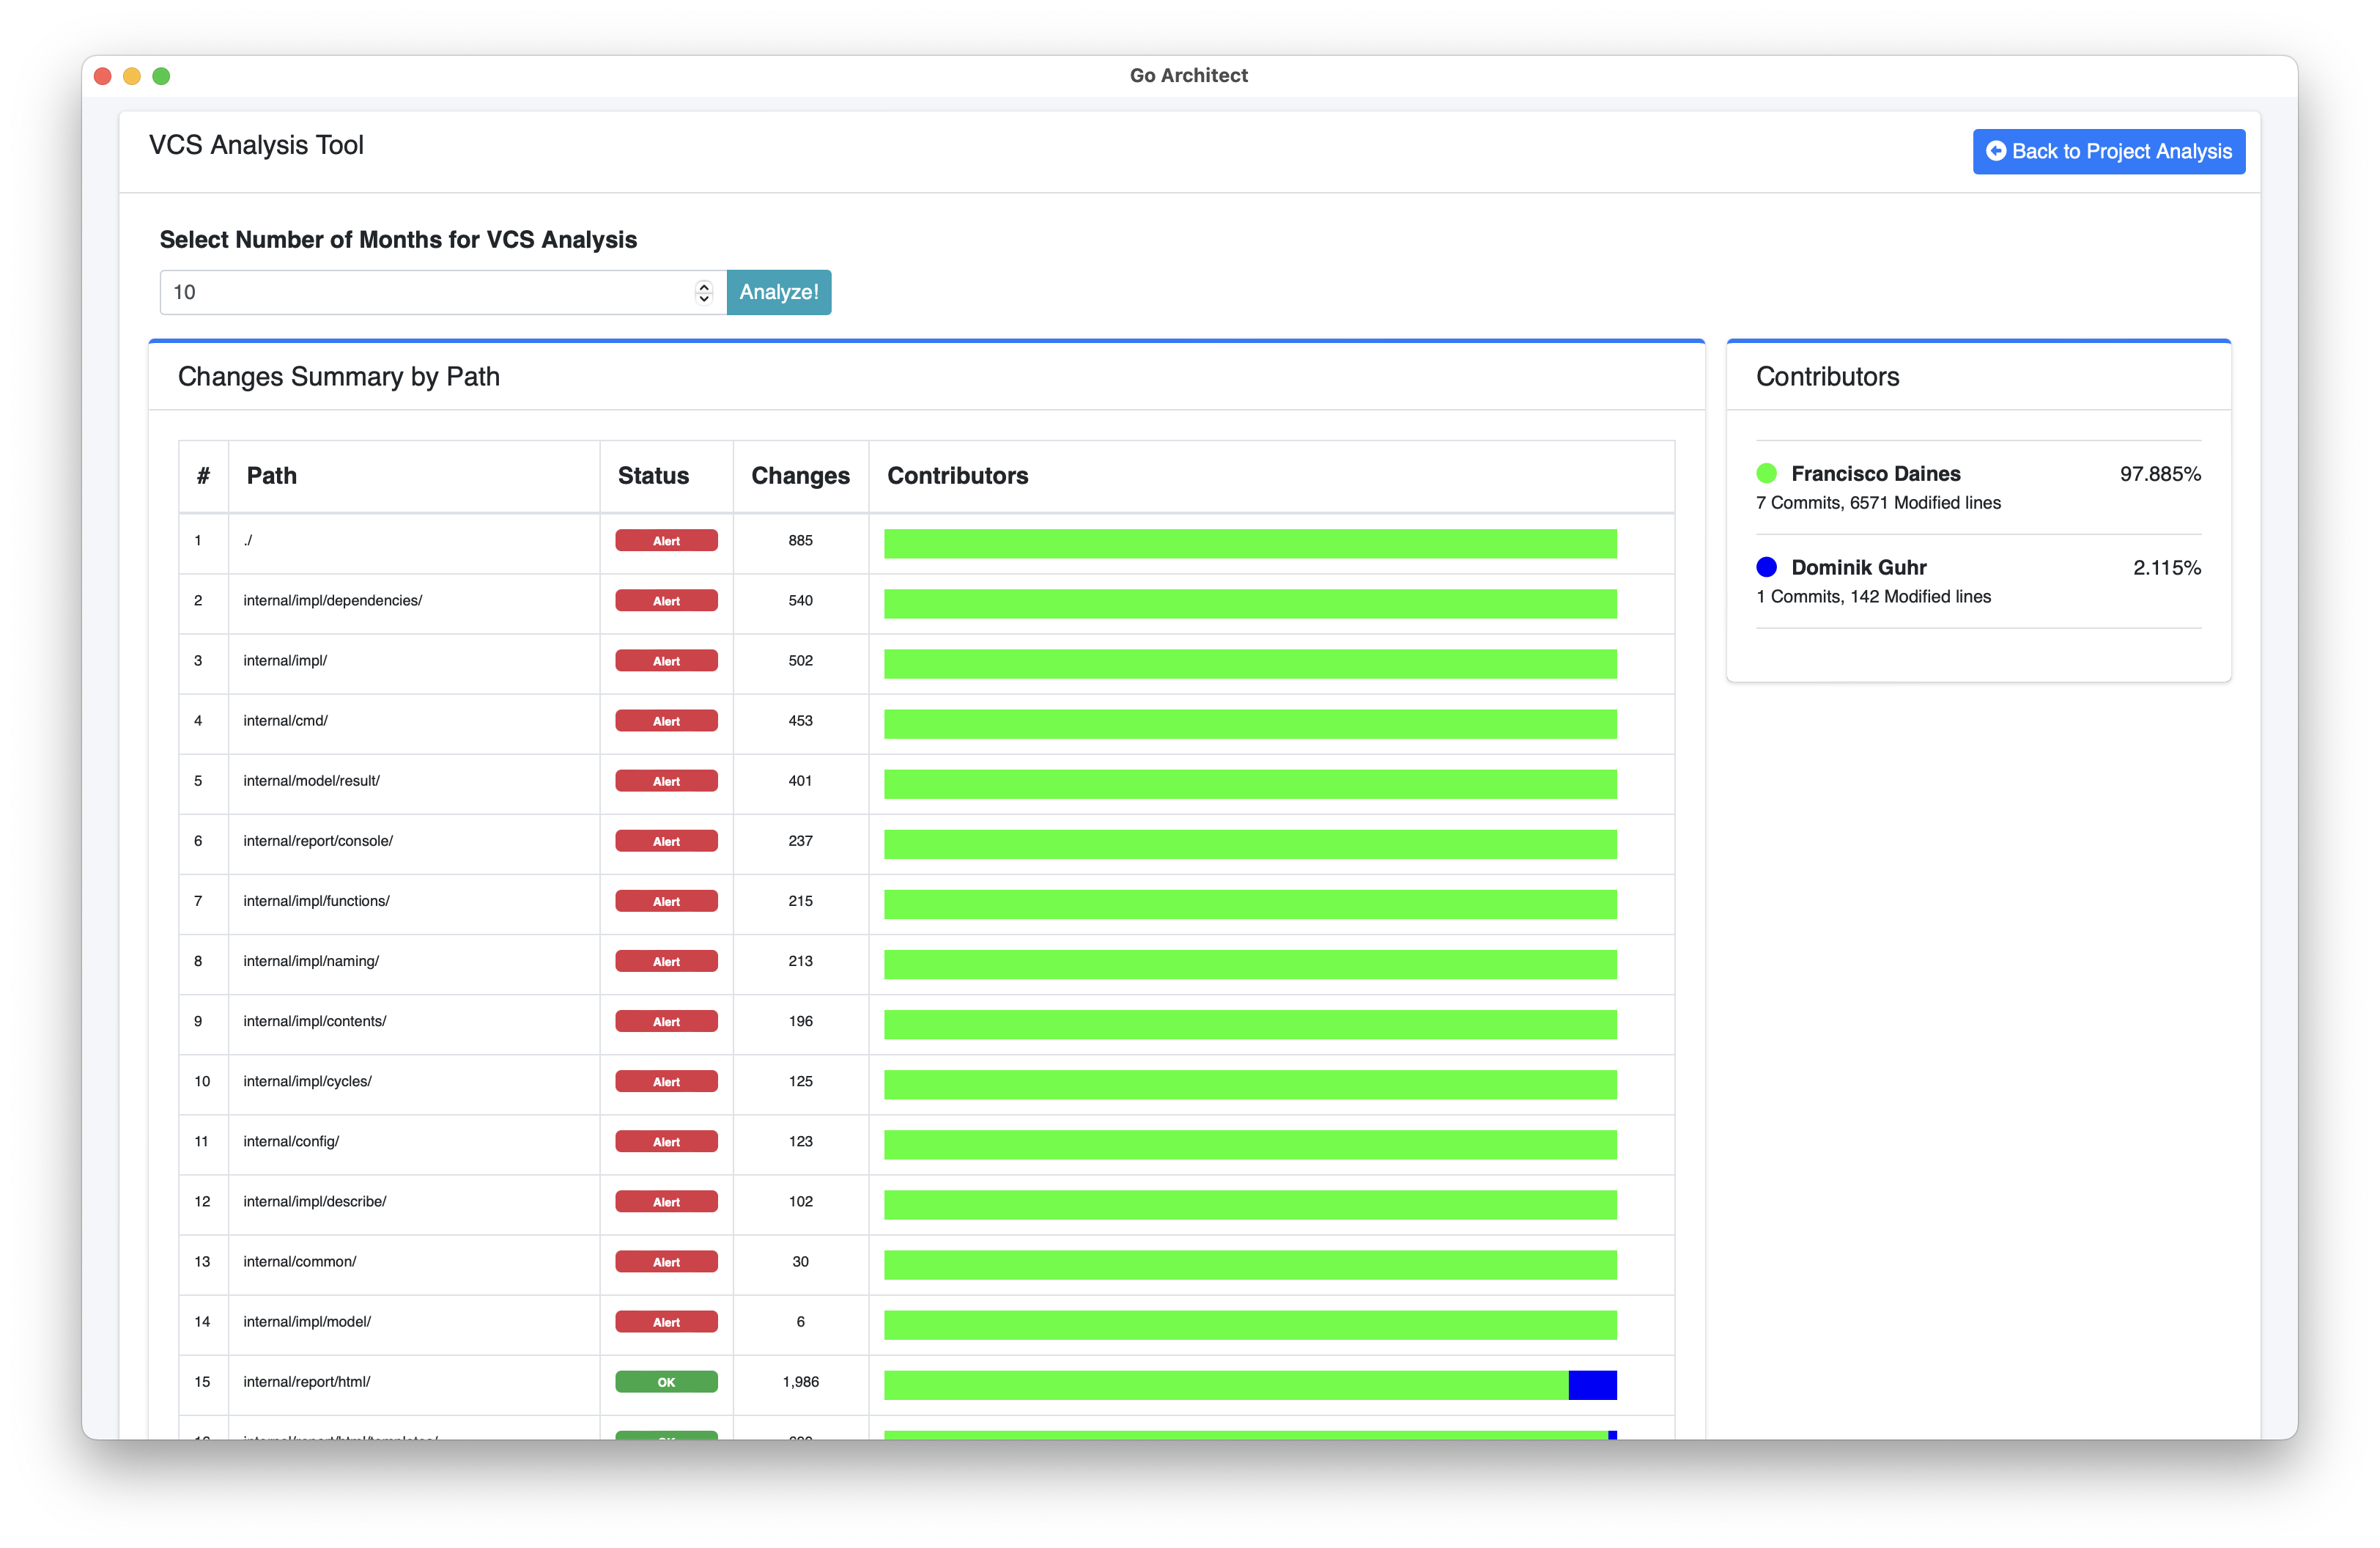
The status widget is useful for identifying packages or files that are at risk of knowledge and context loss in the event that a single developer (or small group of developers) left the project.

To close this Tool, click on Back to Project Analysis button.