Project Metrics
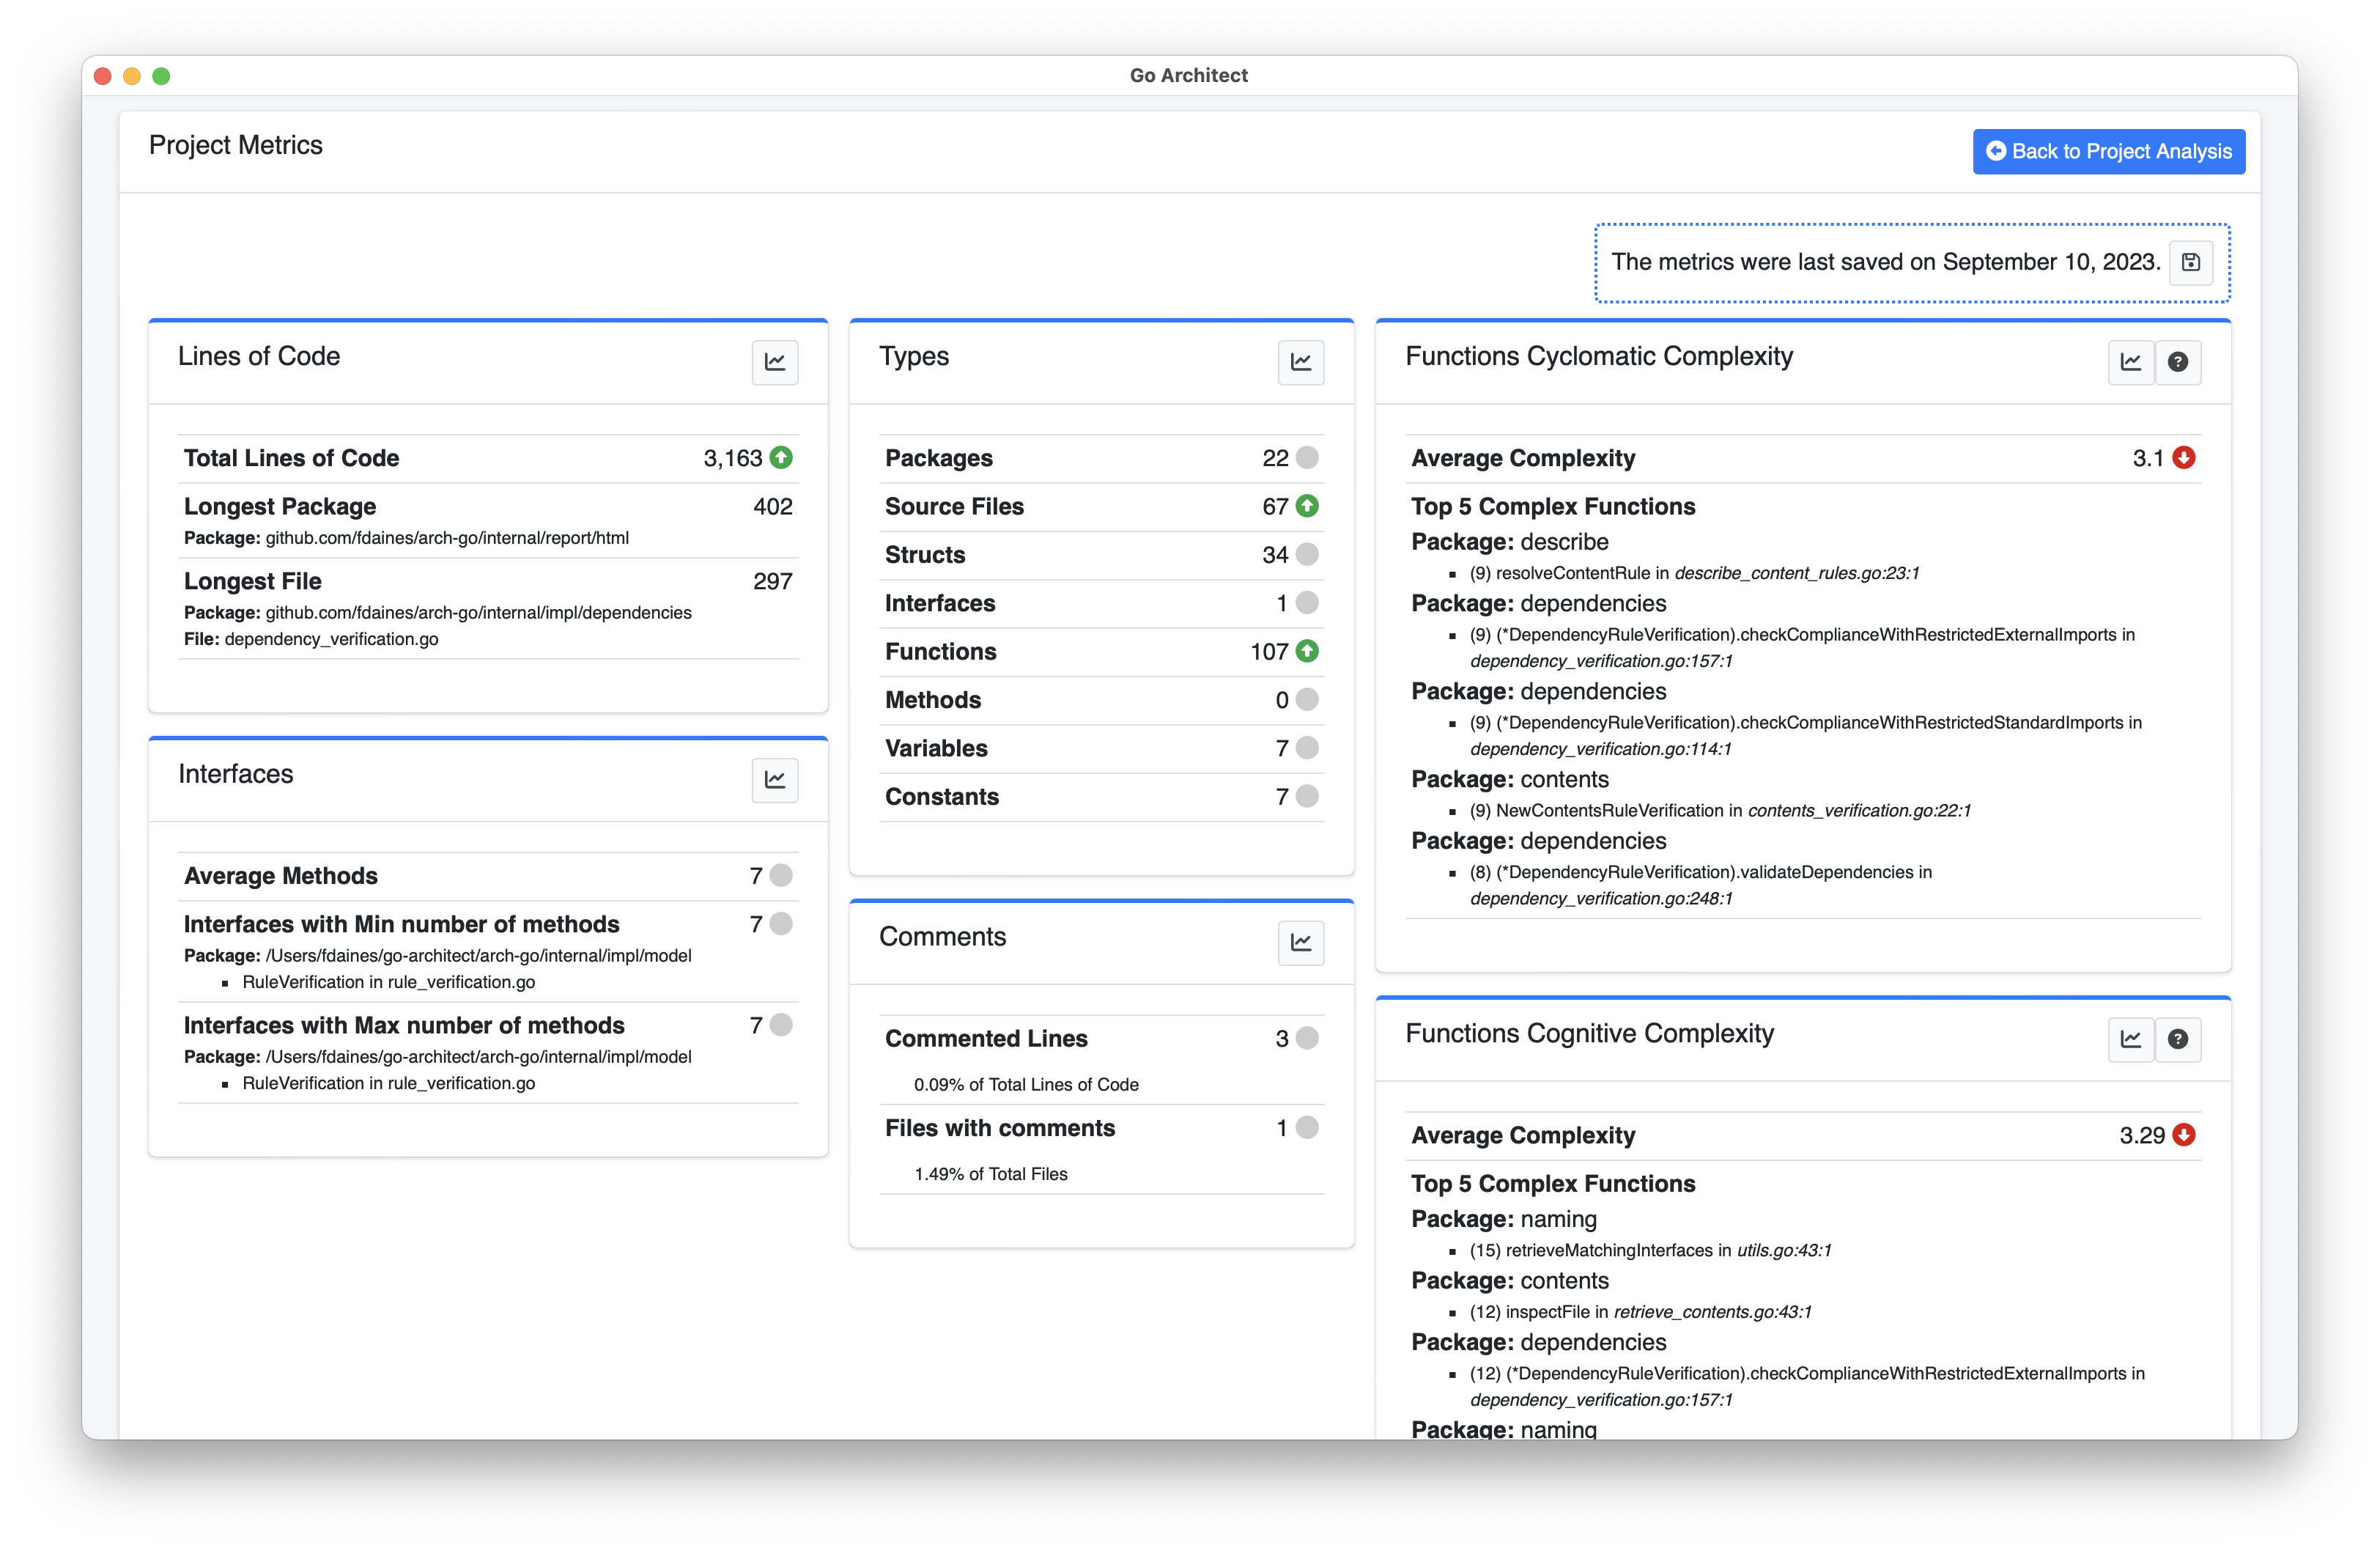
This section provides a deep view of the Project Metrics Tool.
Overview
Project Metrics Tool displays general software metrics, grouped by kind, with an option to save them as snapshots to support an historical view of metrics over time.
Save Snapshots
If you want to save the current metrics as a snapshot, just click on the button.

Note Go-Architect only saves one set of metrics for a day, so in case you click several times this button in a day, then you will be updating the snapshot for the current day.
Metrics Sections
Lines of Code
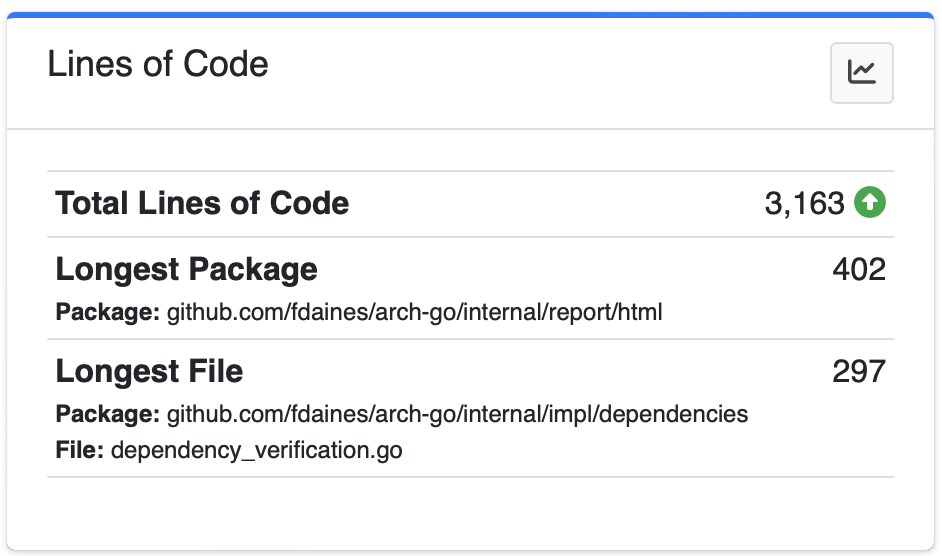
The Lines of Code section contains the following metrics:
- Total Lines of Code: Contains the total number of lines of code in the Go Project, also if you have previous snapshots it will display an icon representing the comparison between the current metric value and the previous analysis.
- Longest Package: Displays the biggest package in your project and its total number of lines of code.
- Longest File: Displays the biggest file in your project, its package and total number of lines of code.
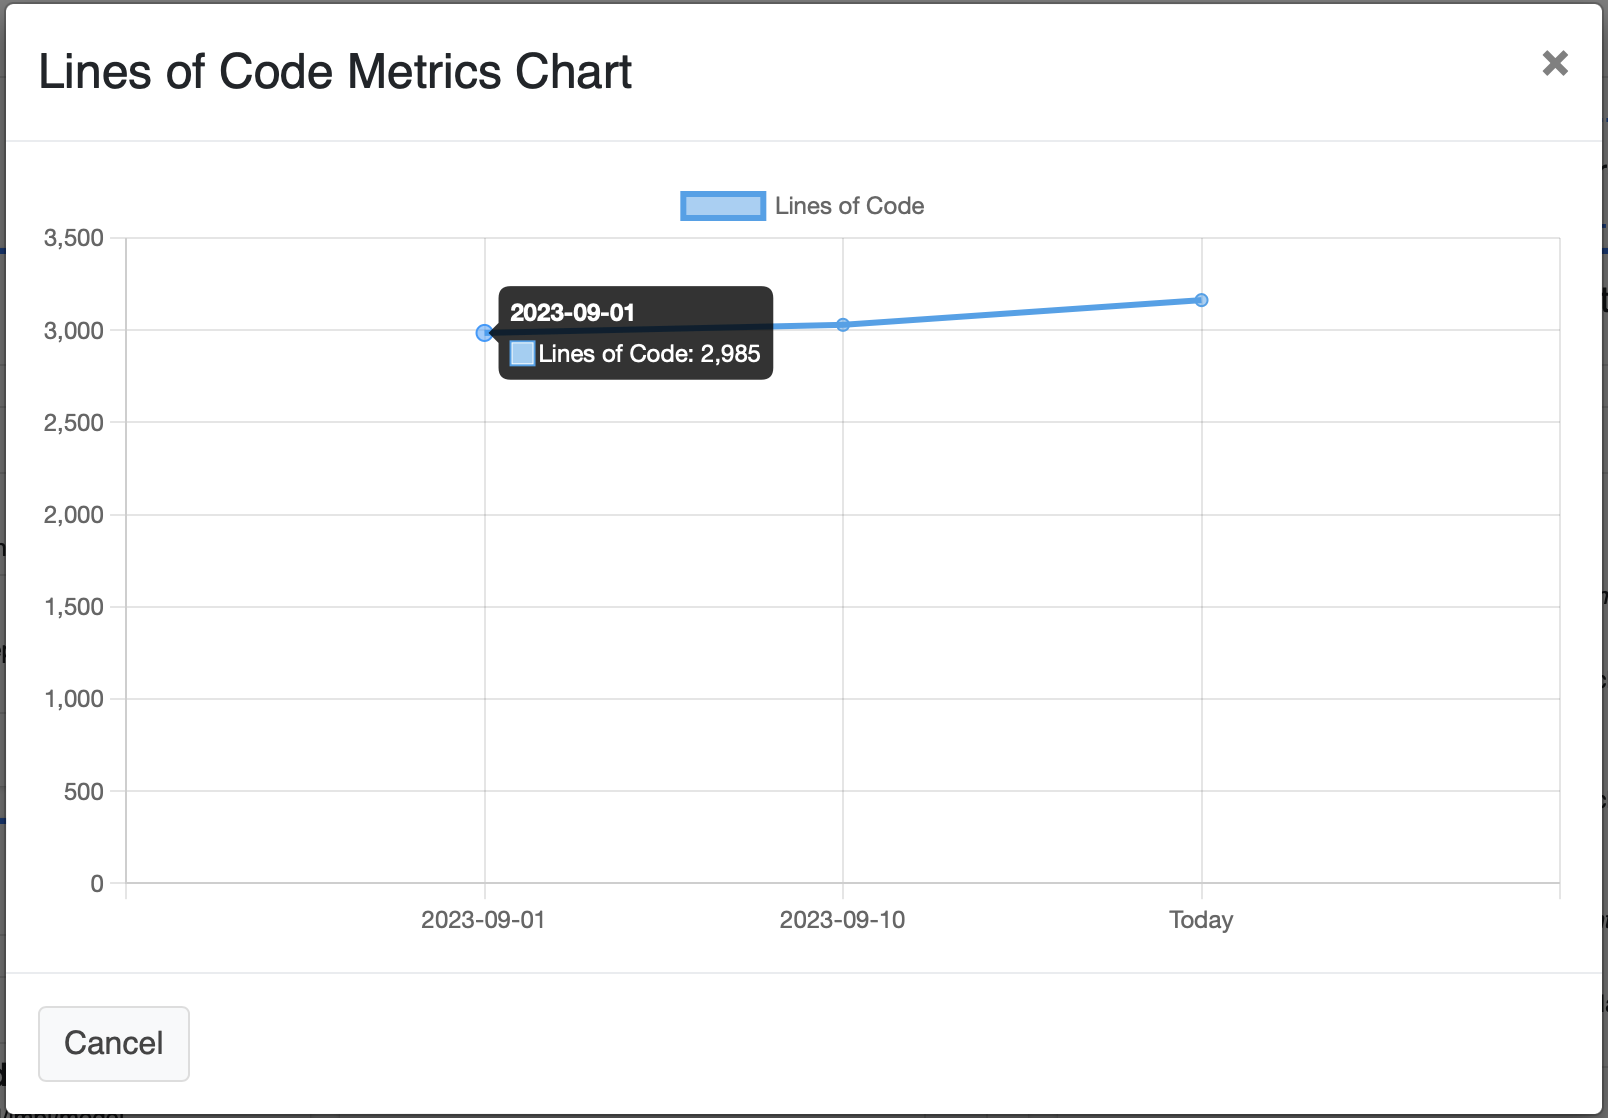
If you click on the button, a chart with the historical evolution for this metric will be displayed.
Interfaces
The Interfaces section contains the following metrics:
- Average Methods: The average number of method declared in all the interfaces in your project.
- Interfaces with max number of methods: Lists all the interfaces that declares the maximum number of methods and their size.
- Interfaces with min number of methods: Lists all the interfaces that declares the minimum number of methods and their size.
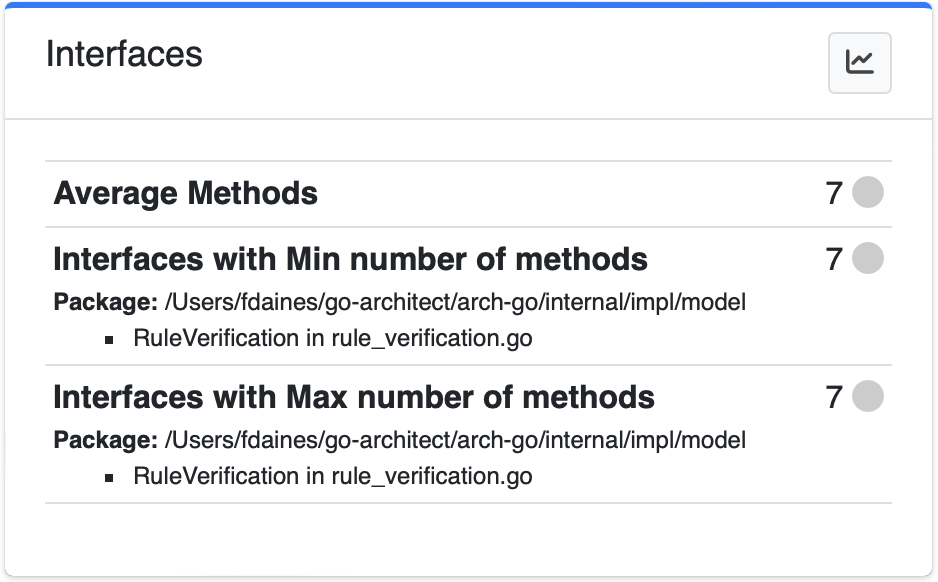
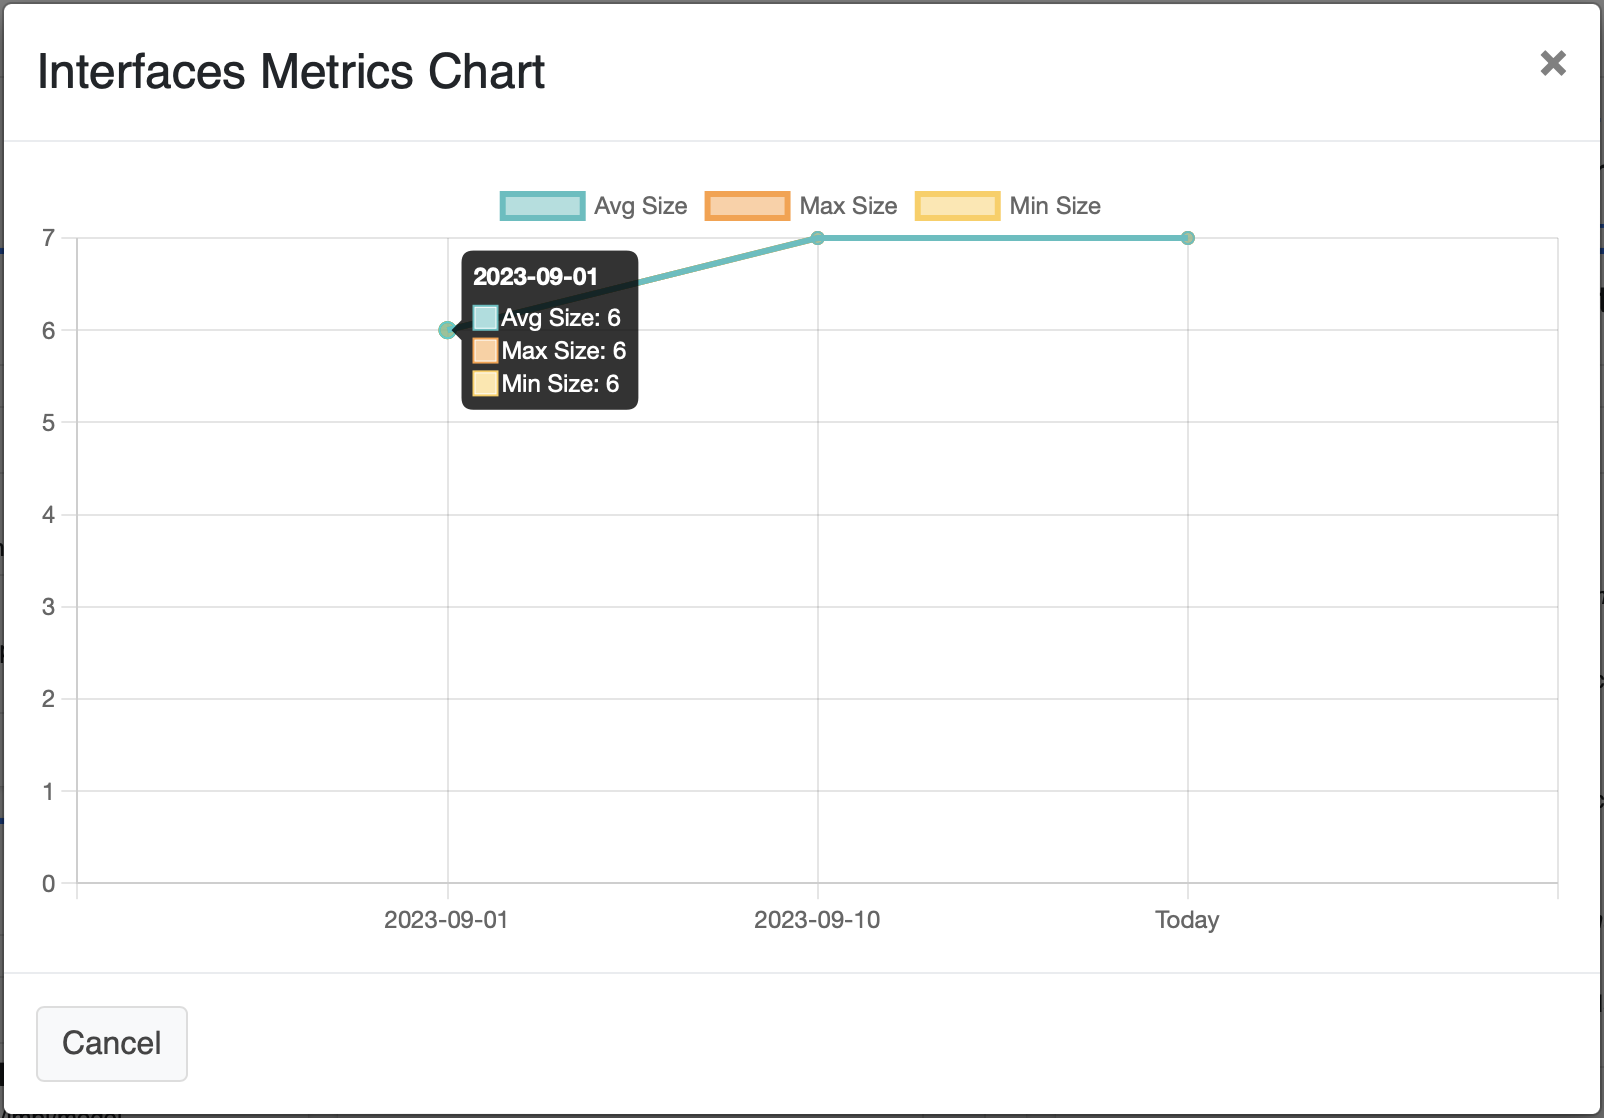
If you click on the button, a chart with the historical evolution for this metrics will be displayed.
Types
The Types section contains the following metrics:
- Packages: Total number of packages in the project.
- Source Files: Total number of source files in the project.
- Structs: Total number of structs declared.
- Interfaces: Total number of interfaces declared.
- Functions: Total number of functions in the project.
- Methods: Total number of methods (a function with a receiver) in the project.
- Variables: Total number of variables declarations.
- Constants: Total number of constants declarations.
All the previous metrics will be compared with the values from the previous snapshot.
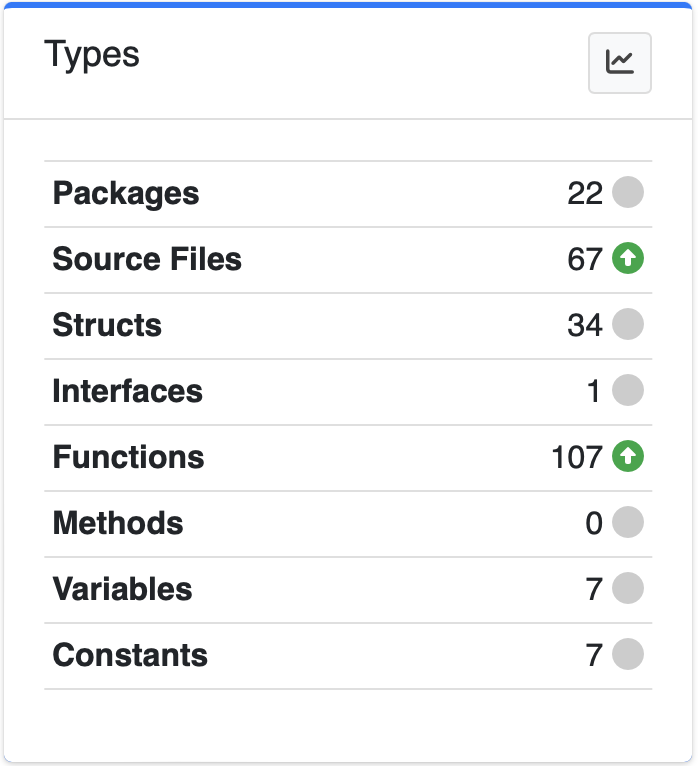
Note Go-Architect considers that a method is a function with a receiver
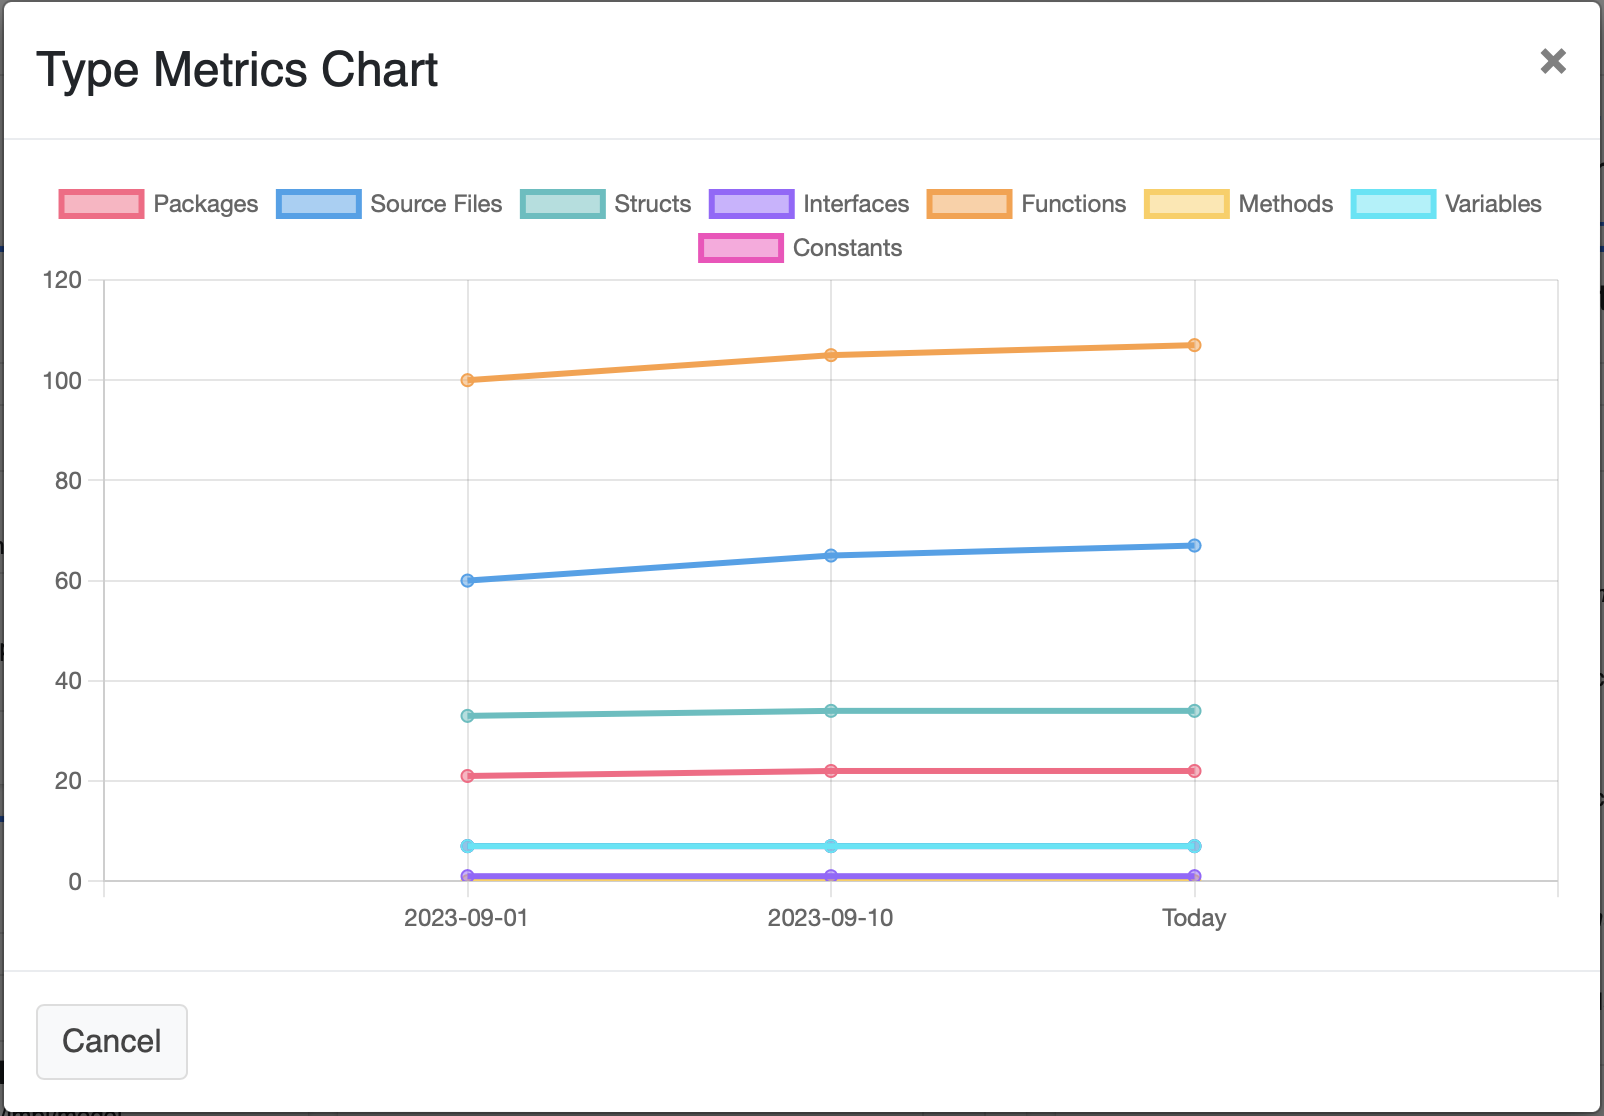
If you click on the button, a chart with the historical evolution for this metrics will be displayed.
Comments
The Comments section contains the following metrics:
- Commented Lines: The number of comment lines in the whole project. The comments ratio is calculated using the total number of code lines in the project.
- Files with Comments: The number of source files that contains comments. The file with comments ratio is calculated using the total number of source files in the project.
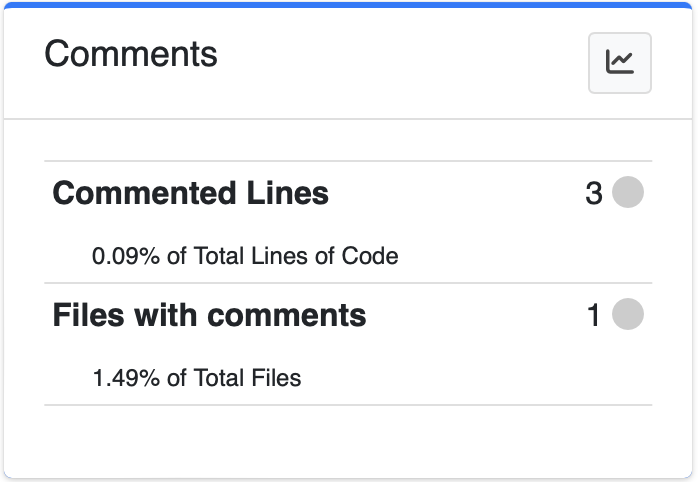
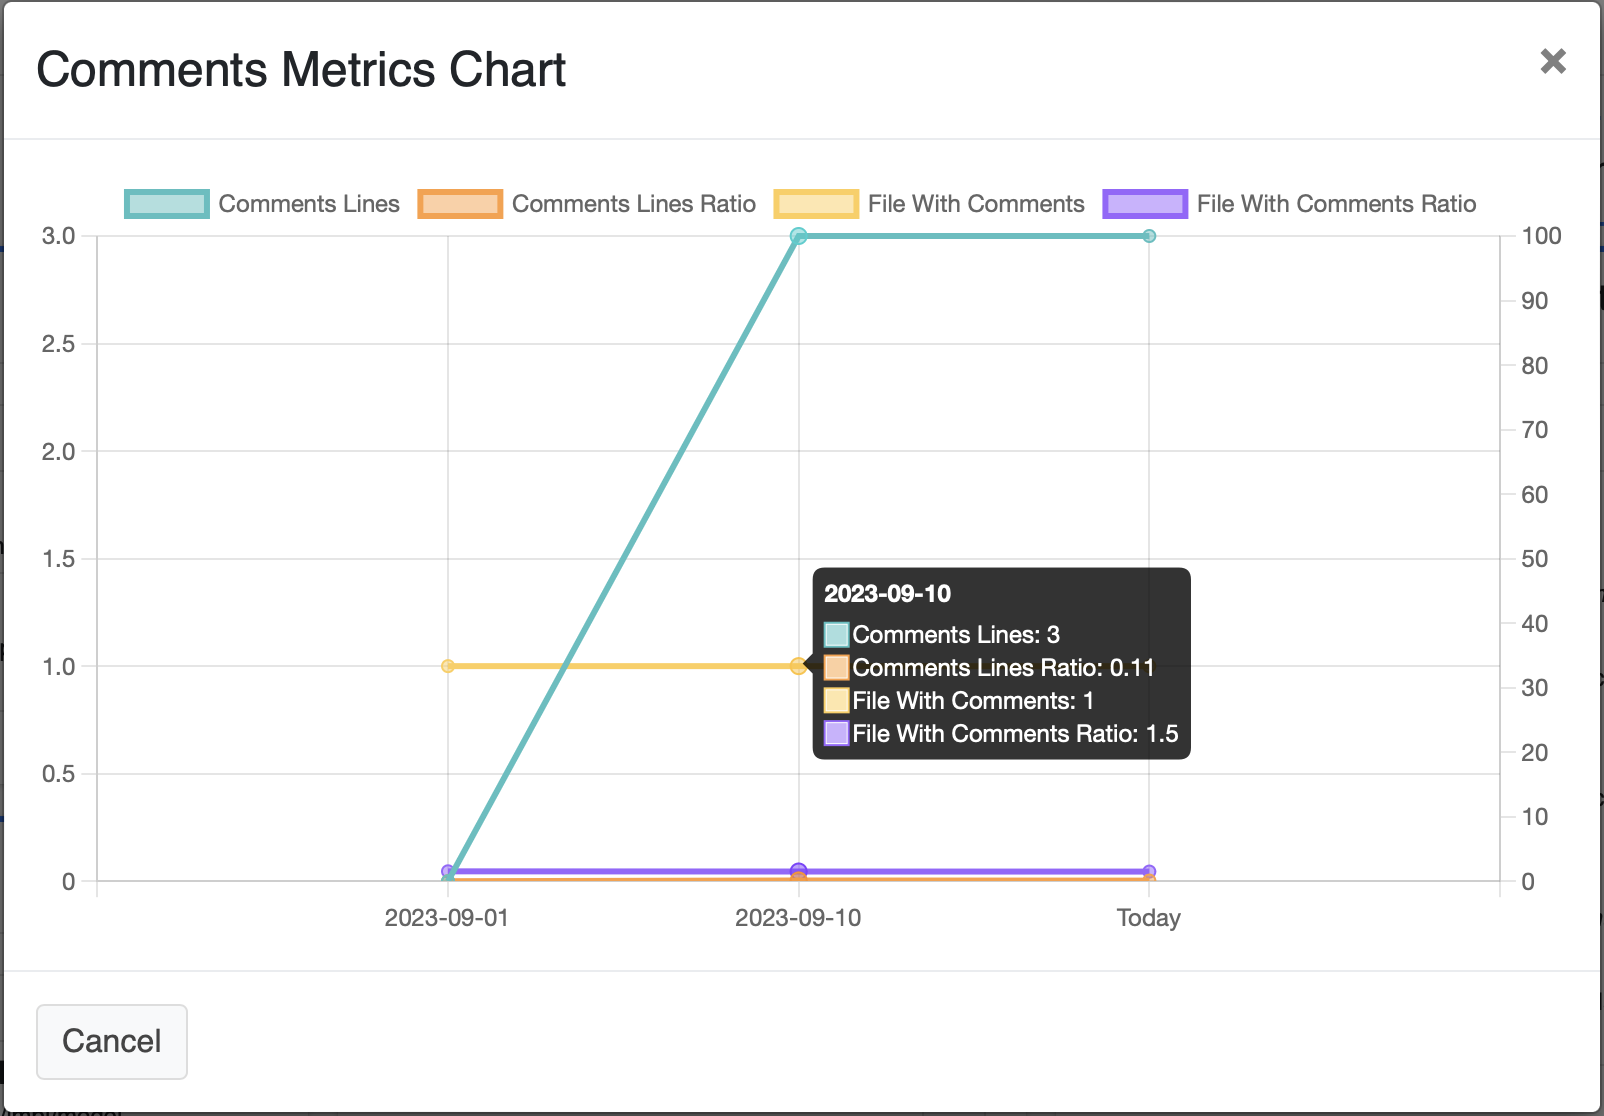
If you click on the button, a chart with the historical evolution for this metrics will be displayed.
Cyclomatic Complexity
This section uses the gocyclo (https://pkg.go.dev/github.com/fzipp/gocyclo) tool to gather the cyclomatic complexity for the Go Project. Based on the output the following data is displayed:
- Average Cyclomatic Complexity
- Top 5 most complex functions in the project.
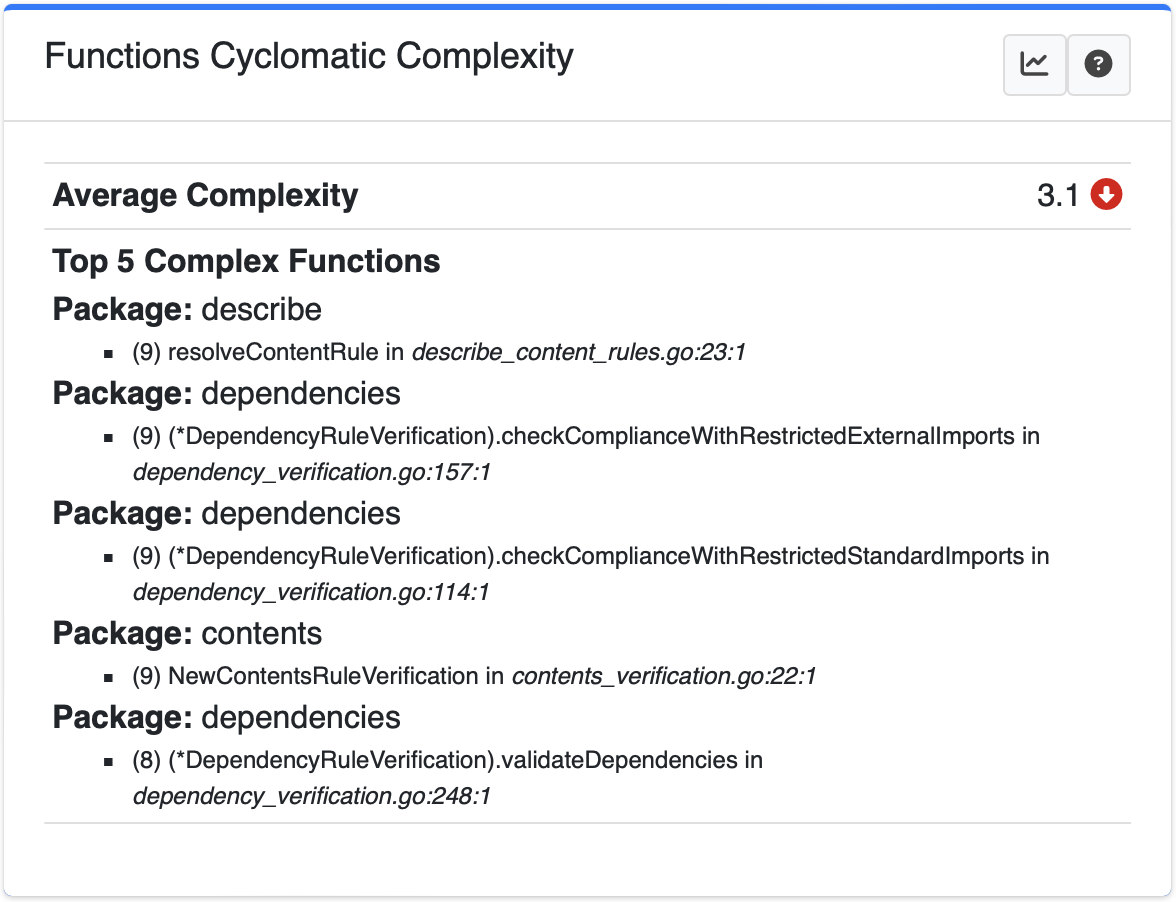
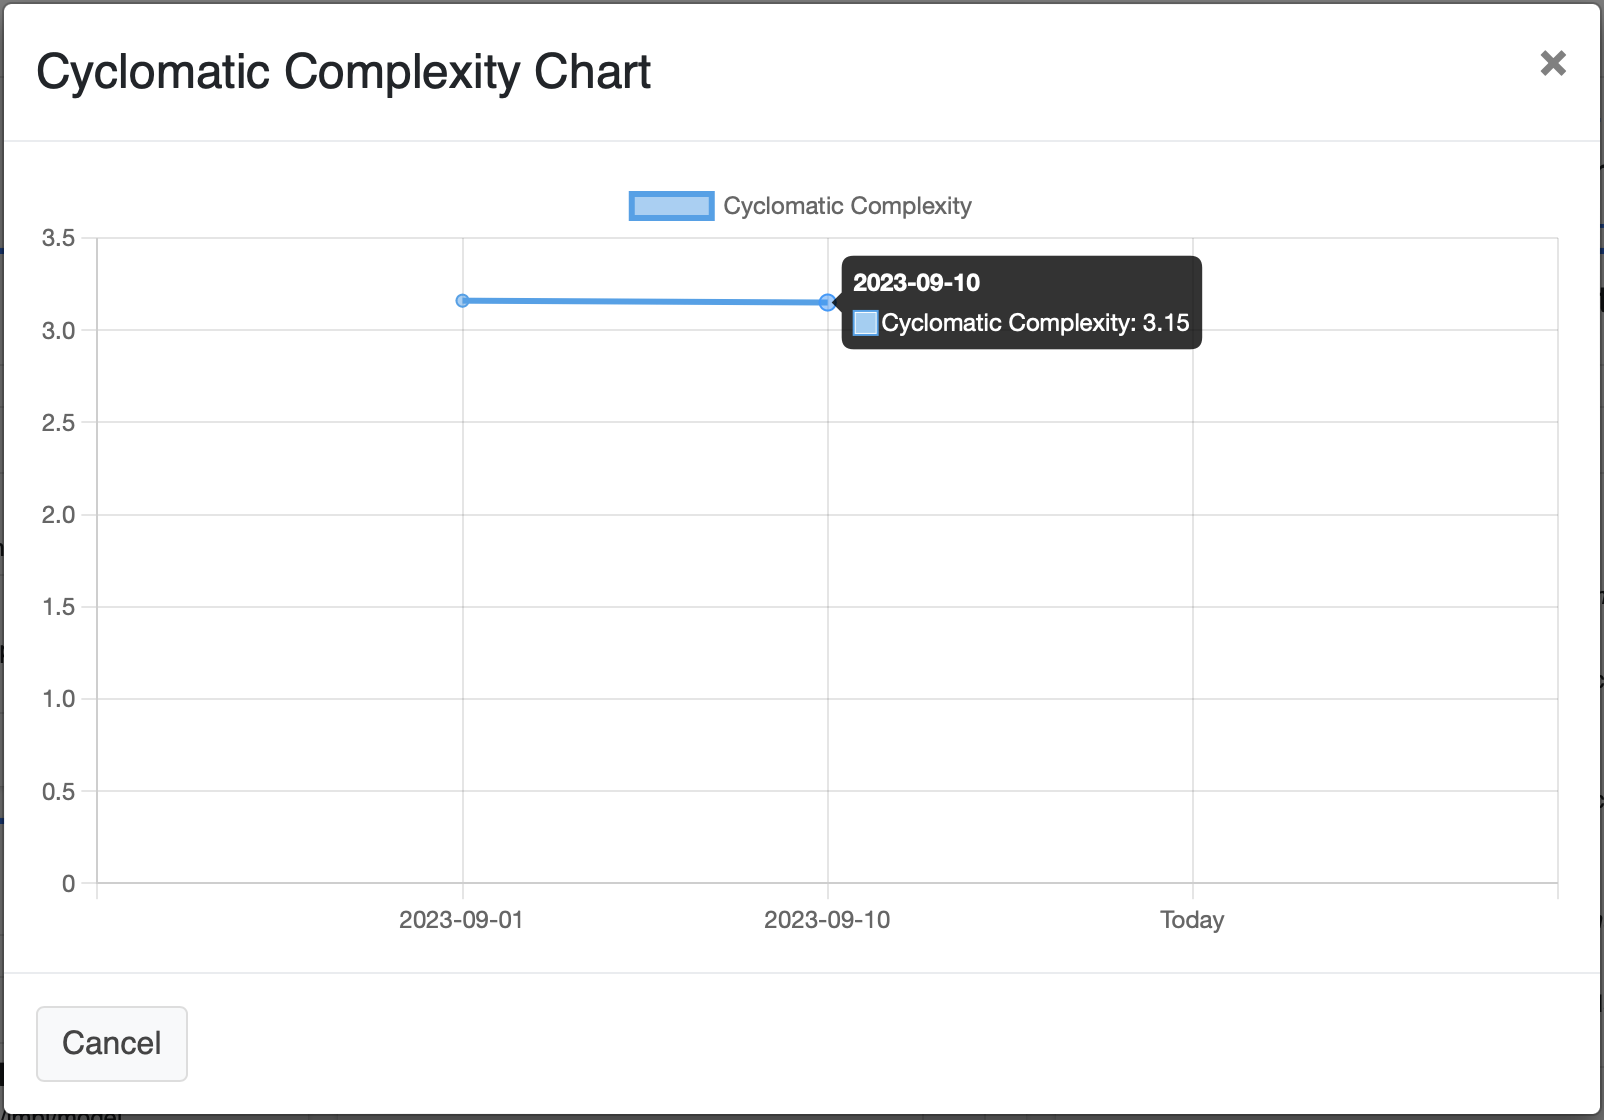
If you click on the button, a chart with the historical evolution for this metric will be displayed.
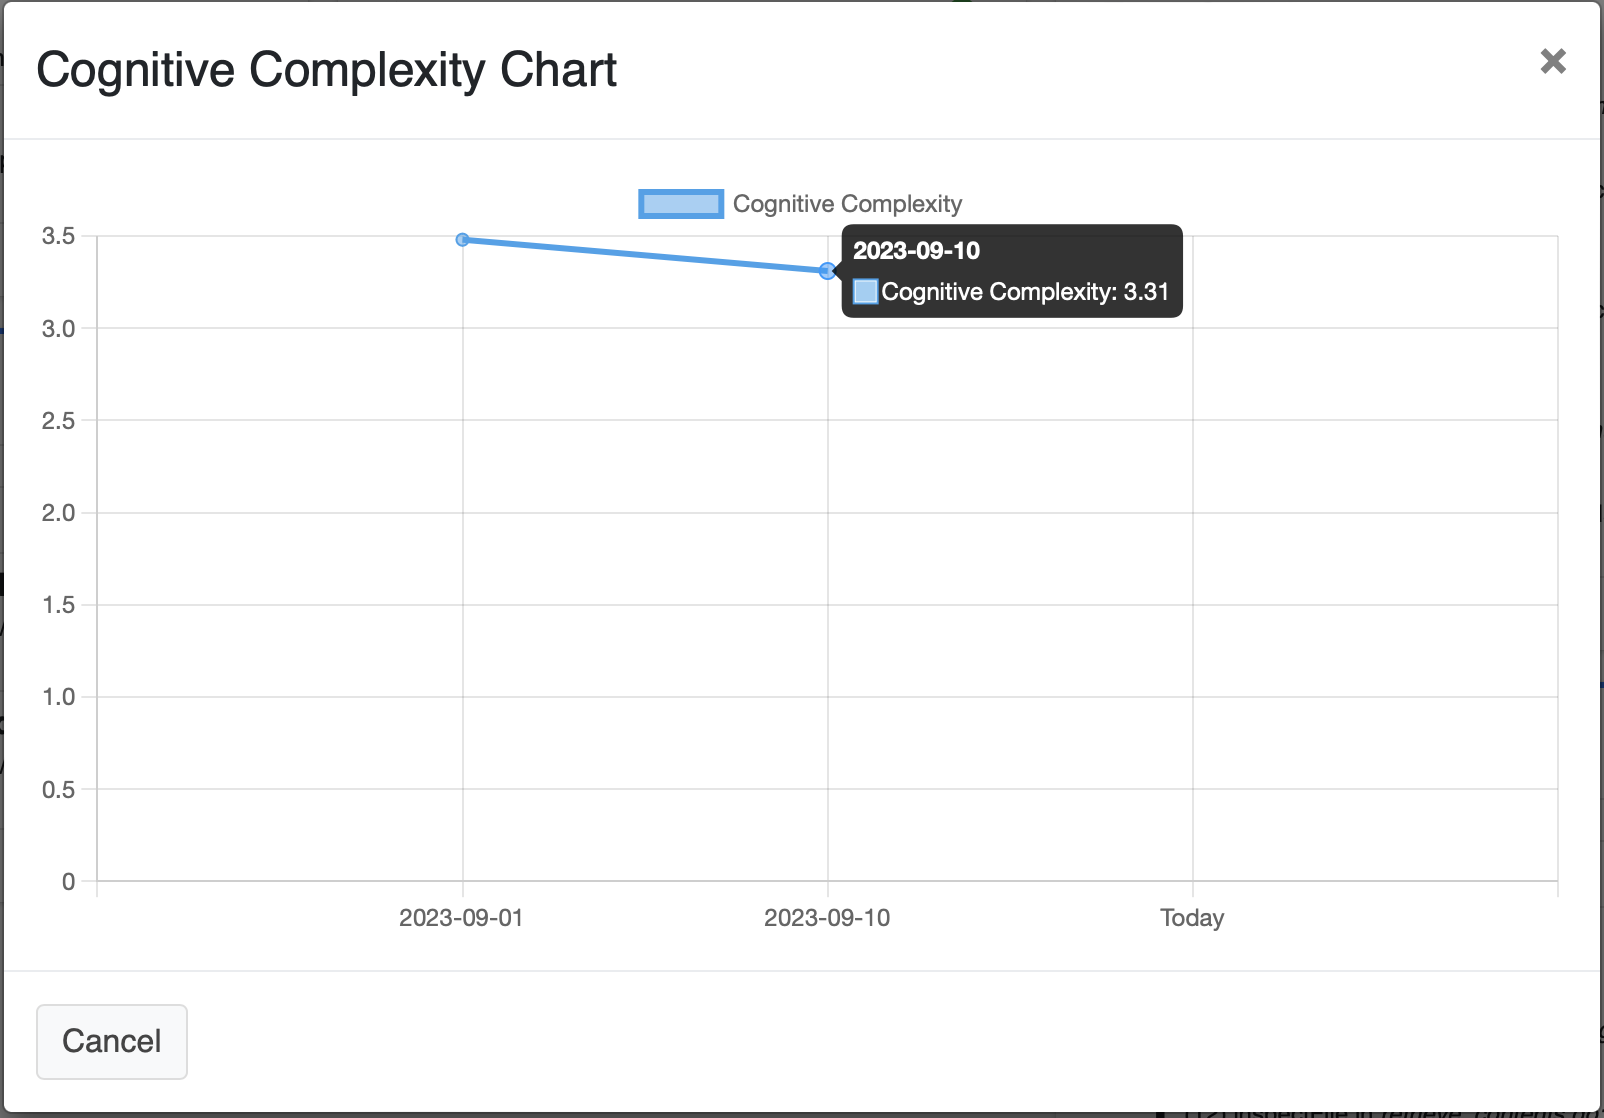
Cognitive Complexity
This section uses the goccognit (https://pkg.go.dev/github.com/uudashr/gocognit) tool to gather the cyclomatic complexity for the Go Project. Based on the output the following data is displayed:
- Average Cognitive Complexity
- Top 5 most complex functions in the project.
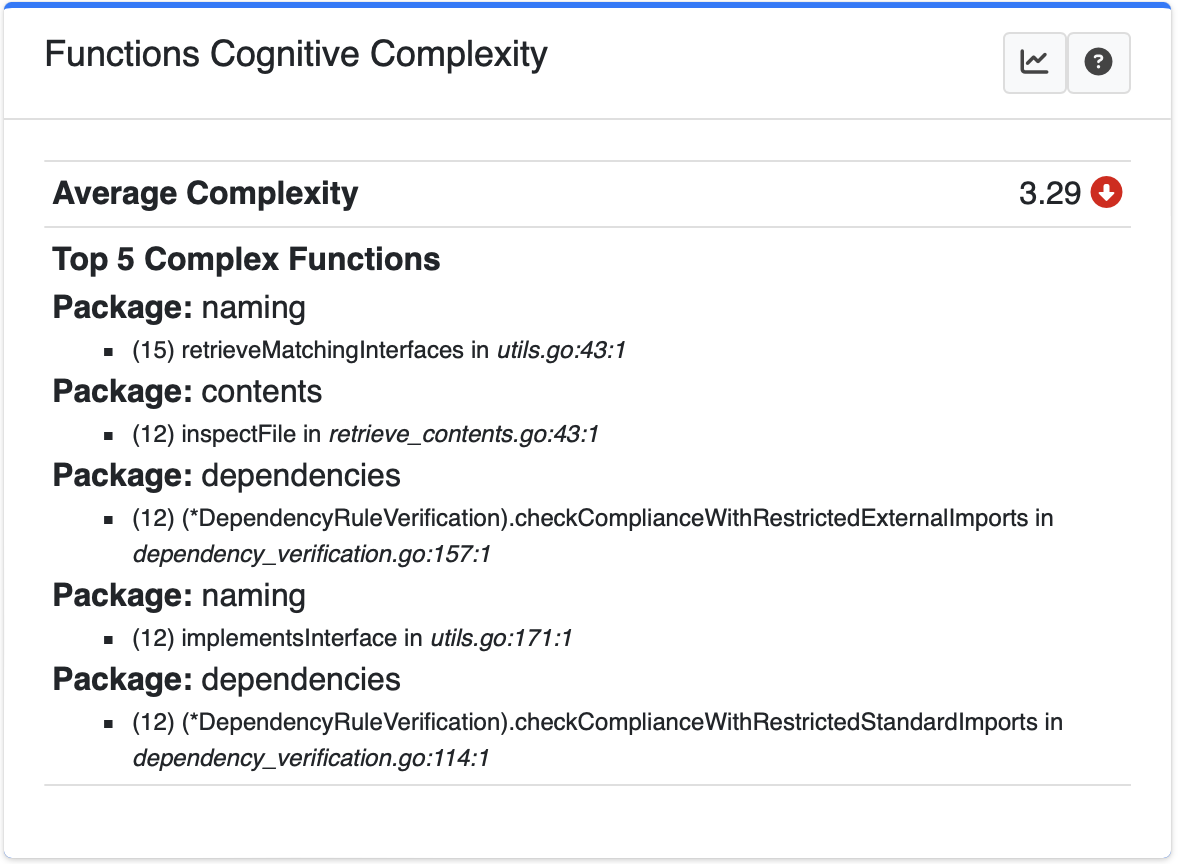
If you click on the button, a chart with the historical evolution for this metric will be displayed.
